
Sarvesh K Verma Solutions for Chapter: Theory of Equations, Exercise 7: Practice Exercise
Sarvesh K Verma Quantitative Aptitude Solutions for Exercise - Sarvesh K Verma Solutions for Chapter: Theory of Equations, Exercise 7: Practice Exercise
Attempt the free practice questions on Chapter 14: Theory of Equations, Exercise 7: Practice Exercise with hints and solutions to strengthen your understanding. Quantum CAT Also Useful for XAT | SNAP | CMAT | MAT solutions are prepared by Experienced Embibe Experts.
Questions from Sarvesh K Verma Solutions for Chapter: Theory of Equations, Exercise 7: Practice Exercise with Hints & Solutions
If the two real roots are distinct, then which of the following may be correct?
The graph of a quadratic equation is symmetrical about Y-axis, which one of the following can't be the roots of a quadratic equation?
If the roots of a quadratic equation are (), then what is the distance between the Y-axis and the axis of symmetry of the pertinent graph?
The distance between the Y-axis and the axis of symmetry is and one of the two roots is , then what can be the other root?
In a set of quadratic equations, the discriminant D for different equations is such that . Then which one of the following is not true?
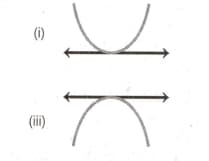
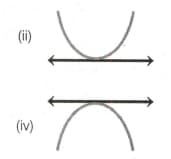
Which one(s) of the following graphs is/are correctly sketched for the given quadratic equation which has a double root (i.e., both the roots are equal), considering that all of these graphs appear considerably thick when seen with a magnifying lens? The horizontal lines, in these graphs, represent the X-axis.
The graph of the equation is shown below. If D denotes the discriminant of this equation; S and P, denote the sum and product of the roots of this equation, respectively. Then which of the following facts is/are true pertaining to this graph?

Some facts are given below for a quadratic equation , and then four graphs are also drawn. If D denotes the discriminant of this equation; S and P denote the sum and product of the roots of this equation, respectively, which one of the following graphs is the best representative of all these facts?


