
Distance-Time Graph
Important Questions on Distance-Time Graph
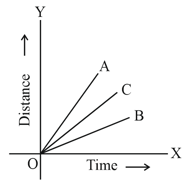
The distance-time graph for the motion of three vehicles A, B and C are as shown in the figure. and
are the speeds of A, B and C, respectively. Compare the speeds of A, B and C.
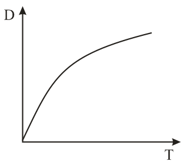
Which of the following distance-time graphs is not possible? Explain why?
By taking suitable example, plot a distance-time graph.
| S No | Time () | Distance () |
| 1 | 0 | 0 |
| 2 | 1 | 5 |
| 3 | 2 | 10 |
| 4 | 3 | 15 |
| 5 | 4 | 20 |
| 6 | 5 | 25 |
| 7 | 6 | 30 |
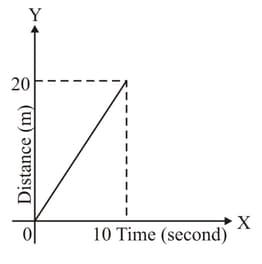
The motion of a body is depicted graphically as shown in the given figure. Then the average speed of the body is _____.
Anju walks to the east, then to the south, then to the west, and finally to the north. What is the distance covered and displacement of Anju?
Observe the graphs and answer the questions.
What type of motion is shown by the body here?
What is the SI unit of speed?
(Choose from Metre per hour, Metre per second, kilometre per second, kilometre per hour)
The figures given below show some vehicles moving on a road in the same direction.
Position of vehicles at 9:00 a.m.
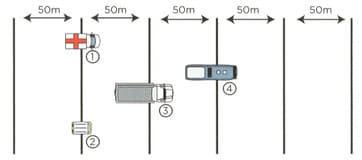
Position of the vehicles at 9:02
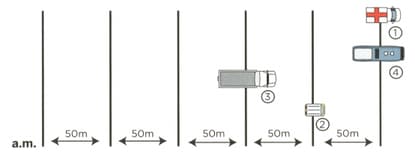
Enter the distances covered in 2 minutes by the vehicles in the given table.
|
Vehicle |
Distance covered (m) |
|
1. |
|
|
2. |
|
|
3. |
|
|
4. |
|
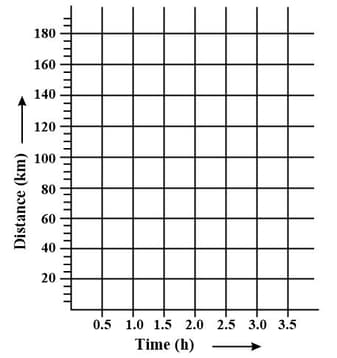
Plot a distance-time graph for the data in the space provided.
A truck and a car set off from a point at the same time and both travel with constant speeds. The truck travels at and the car travels at .
Draw a dotted line on the graph to mark the locations of the truck and car at a point into the journey. How far is each vehicle from the starting point?
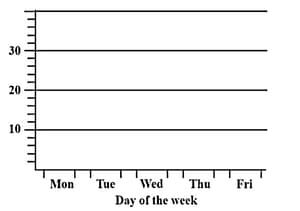
The table records the distances covered by a cyclist during a five-day cycling trip. Draw a bar graph to represent the distances covered during the trip.
| Day | Distance ( ) |
|---|---|
| Monday | |
| Tuesday | |
| Wednesday | |
| Thursday | |
| Friday |
A car is moving at a speed of and a truck is moving at a speed of . The distance-time graph will show
The distance travelled by a bus at various time intervals are as follows:
Draw a distance-time graph for the bus.
| Distance (m) | ||||||
|---|---|---|---|---|---|---|
| Time (s) |
Show the shape of the distance-time graph for the motion in the following cases: A car parked on a side road.
Draw a distance-time graph for a butterfly moving around flowers at a speed of . Calculate the distance travelled by it in one minute.
Show the shape of the distance-time graph for the motion in the following cases:
A car is moving with a constant speed.


