
Graphical Representation of the Frequency Distribution for Grouped Data
Important Questions on Graphical Representation of the Frequency Distribution for Grouped Data
Draw a frequency polygon for the following data without using histogram.
Draw a frequency polygon for the following data using histogram.
The following is the distribution of time spent in the library by students in a school.
Draw a frequency polygon using histogram.
The following table gives the number of literate females in the age group to years in a town.
Draw a histogram to represent the above data
Draw a histogram for the following table which represents the age groups from people in a village.
A graph that displays data that changes continuously over the periods of time is _____ graph.
In a village, there are people who have cell phones. An NGO survey their cell phone usage. Based on this survey a histogram is drawn.
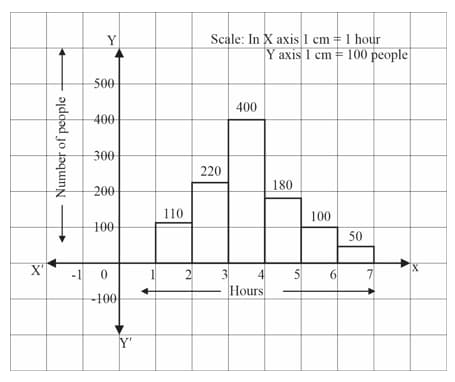
Number of people using cell phone for less than hour?
In a village, there are people who have cell phones. An NGO survey their cell phone usage. Based on this survey a histogram is drawn. Answer the following question.
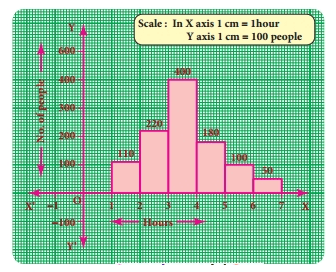
How many of them use the cell phone for more than hours?
In a village, there are people who have cell phones. An NGO survey their cell phone usage. Based on this survey a histogram is drawn. Answer the following question.

How many people use the cell phone for less than hours?
The marks obtained by students in Mathematics are given below. Draw a histogram and a frequency polygon.
The graphical representation of ungrouped data is _____.
In a class interval the upper limit of one class is the lower limit of the other class. This is _____ series.
Inclusive series is a _____ series
The data that can take values between a certain range is called
The difference between the largest value and the smallest value of the given data is_____.
The number of times an observation occurs in the given data is called
Data is a collection of
The marks obtained by students in Mathematics are given below. Make a frequency distribution table taking a class size of marks.
In a study of dental problem, the following data were obtained.
| Age | ||||||||
| No. of patients |
Represent the above data by a frequency polygon.
The distribution of heights (in ) of people is given below. Construct a histogram and the frequency polygon imposed on it.


