
EXERCISE
Subject Experts Mathematics Solutions for EXERCISE
Simple step-by-step solutions to EXERCISE questions of Data Handling from Foundation Course Mathematics. Also get 3D topic explainers, cheat sheets, and unlimited doubts solving on EMBIBE.
Questions from EXERCISE with Hints & Solutions
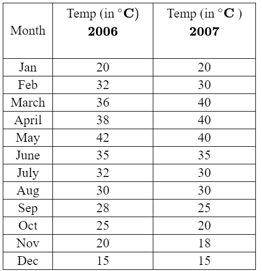
The following table gives the average temperatures, during the year 2006 and 2007. Draw a double bar graph for the given data.
A card is drawn from a pack of 52 cards. What is the probability that it is a red queen?
Find the median of following data sets.
Find the sum of digits of range of data: and
If the mean of observations is , then find the value of .
If the mean of observations is and sum of observations is , then find .
In a box, there are stamps. Each stamp is marked with distinct numbers from . If the probability of drawing a stamp marked even number is , then find .
The range of data is . Find .


