Subject Experts Solutions for Chapter: Venn Diagrams, Exercise 2: EXERCISE - 2
Subject Experts Mental Ability Solutions for Exercise - Subject Experts Solutions for Chapter: Venn Diagrams, Exercise 2: EXERCISE - 2
Attempt the free practice questions on Chapter 10: Venn Diagrams, Exercise 2: EXERCISE - 2 with hints and solutions to strengthen your understanding. Mental Ability for NTSE Stage 1 & 2 Class 10 solutions are prepared by Experienced Embibe Experts.
Questions from Subject Experts Solutions for Chapter: Venn Diagrams, Exercise 2: EXERCISE - 2 with Hints & Solutions
A result of a survey of 1000 persons with respect to their knowledge of Hindi (H), English (E) and Sanskrit (S) is given below.
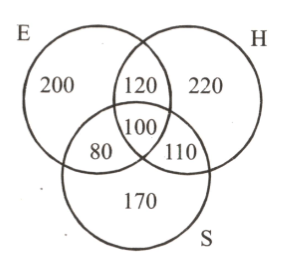
What is the ratio of those who know all the three languages to those who do not know Sanskrit.?
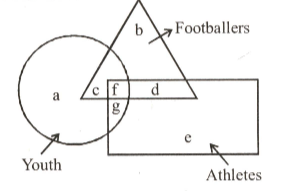
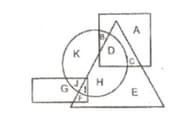
In the figure, the circle represents youth, the triangle represents footballers and the rectangle represents athletes. Which letter(s) represent(s) athletes among youths who are not footballers?
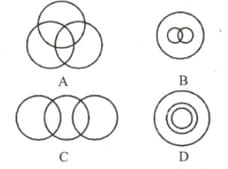
Four diagrams marked A, B, C and D are given below. The one that best illustrates the relationship among three given classes:
Women, Teachers, Doctors
In the following figure, square represents professors, circle represents males, triangle represents cricketers and rectangle represents trainers.
On the basis of information given in the above diagram, which of the following is correct?
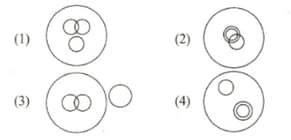
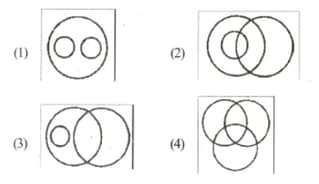
Which of the following diagrams indicates the best relation among men, fathers and teachers?
The figure shows the Gender, Marital Status and Profession (GMP) of a number of people, Each shape shows a different GMP
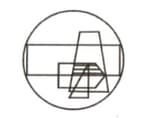
Circle indicates total population, trapezium is males, pentagon is married, rectangle is teachers, and triangle is doctors. What do the shaded regions represent in the diagram?
In a school, commerce and arts subjects were offered. Some students opted only for commerce and some only arts. There were science students also who did not choose any of these subjects. the rest of them accepted both commerce and arts. Which one of the following Venn diagram correctly reflects