
Subject Experts Solutions for Chapter: Introduction to Graphs, Exercise 4: SUMMATIVE ASSESSMENT
Subject Experts Mathematics Solutions for Exercise - Subject Experts Solutions for Chapter: Introduction to Graphs, Exercise 4: SUMMATIVE ASSESSMENT
Attempt the practice questions on Chapter 15: Introduction to Graphs, Exercise 4: SUMMATIVE ASSESSMENT with hints and solutions to strengthen your understanding. NCERT Practice Workbook Mathematics solutions are prepared by Experienced Embibe Experts.
Questions from Subject Experts Solutions for Chapter: Introduction to Graphs, Exercise 4: SUMMATIVE ASSESSMENT with Hints & Solutions
The line graph given below shows the side of a square and its perimeter.
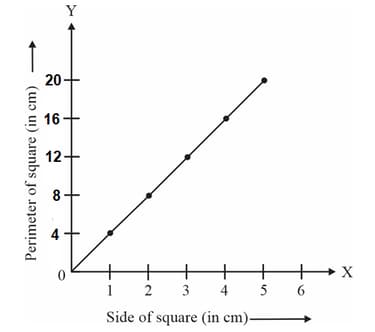
The perimeter is , If the side of the square is , find .
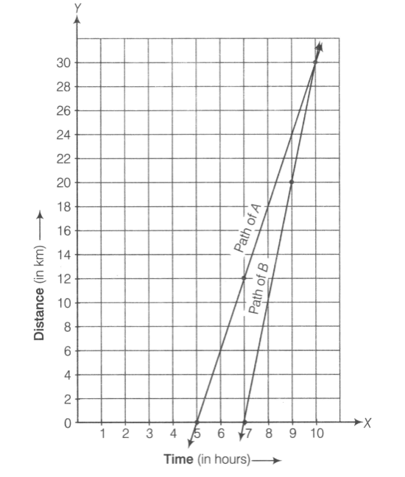
In the given graph, starts walking at at a speed of . After , starts from the same point by bicycle in the same direction at a speed of , then by using the graph, if the distance covered by and when they meet is , then find the value of .
The line graph given below shows the sales of a shopkeeper in the first week of January, .
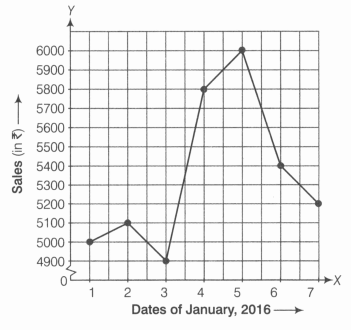
If the cost of one doll is , then how many dolls were sold on January, by the shopkeeper?
Using the graph below, answer the questions given below.
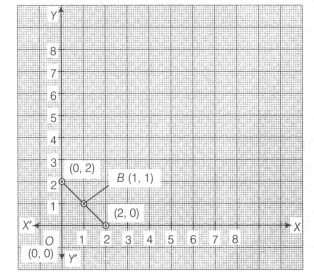
Which is the nearest point to origin?
A person moves units left (due West) from a point and then moves units downwards(due south). If his new position is , Find the value of .
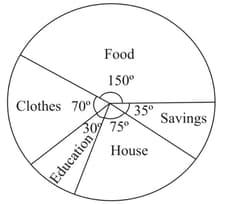
Observe the given circle graph (pie chart) and given that the monthly salary of the family is . If the difference in expenditures on clothes and education is , then find the value of .
A survey of endangered penguins was carried out on a small island.
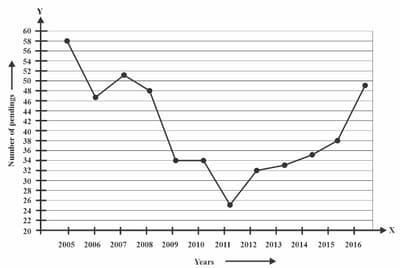
Which year showed the lowest population of penguins?
A survey of endangered penguins was carried out on a small island.
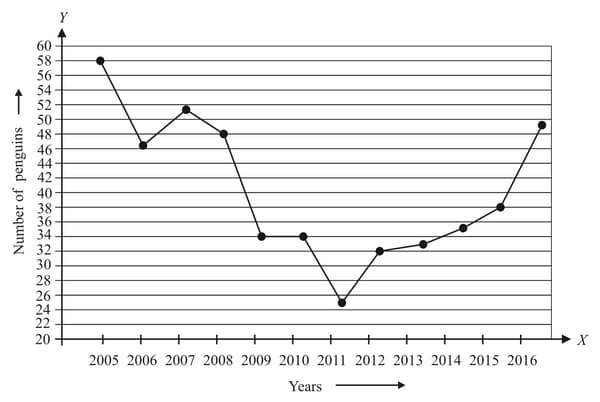
What was the population decrease between and ?


