
Subject Experts Solutions for Chapter: Visualising Solid Shapes, Exercise 4: SUMMATIVE ASSESSMENT
Subject Experts Mathematics Solutions for Exercise - Subject Experts Solutions for Chapter: Visualising Solid Shapes, Exercise 4: SUMMATIVE ASSESSMENT
Attempt the practice questions on Chapter 10: Visualising Solid Shapes, Exercise 4: SUMMATIVE ASSESSMENT with hints and solutions to strengthen your understanding. NCERT Practice Workbook Mathematics solutions are prepared by Experienced Embibe Experts.
Questions from Subject Experts Solutions for Chapter: Visualising Solid Shapes, Exercise 4: SUMMATIVE ASSESSMENT with Hints & Solutions
Using square graph paper, draw cube .
Using square graph paper, draw cuboid .
Using square graph paper, draw a triangular prism with height .
Give two differences between a picture and a map.
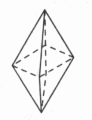
Complete the table by referring to the diagram given below, where represents the number of faces of a solid, represents the number of edges and represents the number of vertices. In each case, verify the Euler's formula, .
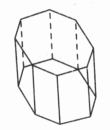
Complete the table by referring to the diagram given below, where represents the number of faces of a solid, represents the number of edges and represents the number of vertices. In each case, verify the Euler's formula, .
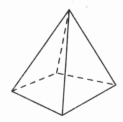
Complete the table by referring to the diagram given below, where represents the number of faces of a solid, represents the number of edges and represents the number of vertices. In each case, verify the Euler's formula, .
A discussion between elderly people was taking place in a park. They were talking about the environmental changes occurring day by day. One other group of grandchildren was also sitting beside them who came with their grandparents. After hearing their grandparent, the kids decided to fulfil the wish of greenery. They decided to plant more and more trees along the walking track which is long. They draw the map in the notebook using the scale . In the map, the distance between each tree is .
How pollution is harmful to us?


