
Subject Experts Solutions for Chapter: Statistics, Exercise 1: PRACTICE QUESTIONS (CLASSROOM WING)
Subject Experts Mathematics Solutions for Exercise - Subject Experts Solutions for Chapter: Statistics, Exercise 1: PRACTICE QUESTIONS (CLASSROOM WING)
Attempt the free practice questions on Chapter 9: Statistics, Exercise 1: PRACTICE QUESTIONS (CLASSROOM WING) with hints and solutions to strengthen your understanding. Pearson IIT Foundation Mathematics solutions are prepared by Experienced Embibe Experts.
Questions from Subject Experts Solutions for Chapter: Statistics, Exercise 1: PRACTICE QUESTIONS (CLASSROOM WING) with Hints & Solutions
When a dice is thrown, the outcomes are _____
Read the following bar graph and answer the following
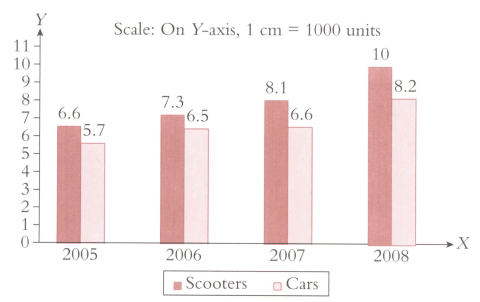
In which year is the difference between the sales of scooters and sales of car is the least?
Read the following bar graph and answer the following
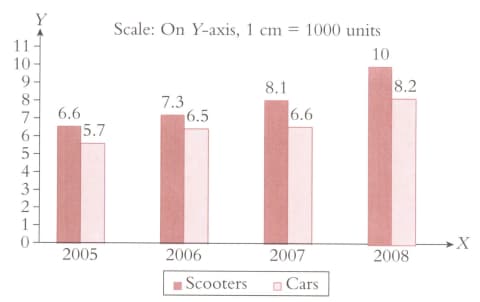
Total number of vehicles (sccoter and car) sold in the year is
Read the following bar graph and answer the following

Find the maximum difference between sales of sccoters and that of cars in any year in the given period
Read the following bar graph and answer the following

Find the total number of sccoters sold in the four year
Read the following bar graph and answer the following

Find the ratio between the total number of vehicles sold (scooter and car) in the year and that in year .
There are cards numbered from to in a box. If a card is drawn randomly, then find the probability of getting an even-numbered card.
The mode of the data is _____


