
Vistor Chow wal keung | RC Yadav Solutions for Chapter: Data Handling, Exercise 6: REVIEW EXERCISE
Vistor Chow wal keung | RC Yadav Mathematics Solutions for Exercise - Vistor Chow wal keung | RC Yadav Solutions for Chapter: Data Handling, Exercise 6: REVIEW EXERCISE
Attempt the free practice questions on Chapter 17: Data Handling, Exercise 6: REVIEW EXERCISE with hints and solutions to strengthen your understanding. CPA Maths - A Singapore Approach solutions are prepared by Experienced Embibe Experts.
Questions from Vistor Chow wal keung | RC Yadav Solutions for Chapter: Data Handling, Exercise 6: REVIEW EXERCISE with Hints & Solutions
A class of students was randomly divided into two equal groups, A and B. Each group was taught a new mathematics topic using different methods. Their scores in a common test on that topic are as follows.
| Group A | ||||||||
| Group B |
Find the mean and median scores of Group A.
A class of students was randomly divided into two equal groups, A and B. Each group was taught a new mathematics topic using different methods. Their scores in a common test on that topic are as follows.
| Group A | ||||||||
| Group B |
Find the mean and median scores of Group B.
A class of students was randomly divided into two equal groups, A and B. Each group was taught a new mathematics topic using different methods. Their scores in a common test on that topic are as follows.
| Group A | ||||||||
| Group B |
Which group's performance is better? Why?
The number of goals scored by football teams in the football league is shown in the following table.
| Number of goals | ||||
| Number of teams |
State the largest possible value of if the mode is goal
The bar graph below shows the number of students who participated in the club activities of a school.

Find the ratio of the number of male students to that of female students in the chess club.
The bar graph below shows the number of students who participated in the club activities of a school.

Which club is the most popular among all the students?
The bar graph below shows the number of students who participated in the club activities of a school.

Which club has an equal number of male and female students?
The bar graph below shows the number of students who participated in the club activities of a school.
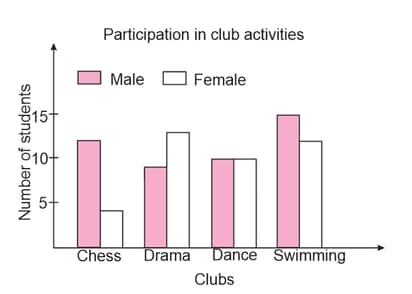
Find the total number of students in the four clubs.


