
Vistor Chow wal keung and RC Yadav Solutions for Chapter: Data Handling and Graphs, Exercise 6: EXERCISE
Vistor Chow wal keung Mathematics Solutions for Exercise - Vistor Chow wal keung and RC Yadav Solutions for Chapter: Data Handling and Graphs, Exercise 6: EXERCISE
Attempt the free practice questions on Chapter 17: Data Handling and Graphs, Exercise 6: EXERCISE with hints and solutions to strengthen your understanding. CPA Maths - A Singapore Approach solutions are prepared by Experienced Embibe Experts.
Questions from Vistor Chow wal keung and RC Yadav Solutions for Chapter: Data Handling and Graphs, Exercise 6: EXERCISE with Hints & Solutions
The bar graph below shows Andrew's income and expenditure for each month from January to March.
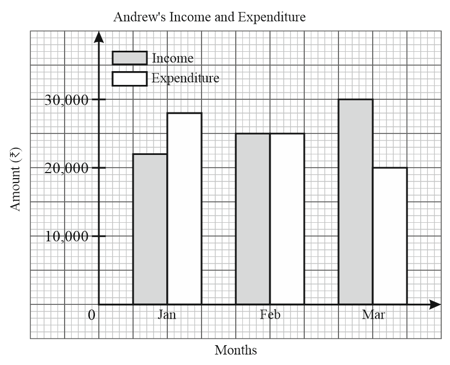
Determine whether his total income in the three months was greater than his total expenditure for the same period.
The following frequency table shows the distribution of floor areas of residential apartments.
| Area in | Frequency |
Draw a histogram to represent the data.
The times taken by a technician to complete repair jobs are recorded in the following frequency table.
| Time in minutes | Frequency |
| _____ | _____ |
Given that the distribution has uniform class width, state the missing information in the table.
The times taken by a technician to complete repair jobs are recorded in the following frequency table.
| Time in minutes | Frequency |
| _____ | _____ |
Draw a histogram to represent the data.
Sujata had sampled an equal number of boys and girls at her school when she surveyed their preferred snack choice. The table below shows the results of the survey.
| Preferred Snack Choices of Students at Sujata's School | ||
| Boys | Girls | |
| Candy | ||
| Chips | ||
| Chocolate bars | ||
| Cookies | ||
| Fruit | ||
| Ice cream | ||
| Popcorn | ||
| Pastry | ||
Draw one suitable bar graph to show a comparison of snack food preferences by gender in Sujata's school.
Sujata had sampled an equal number of boys and girls at her school when she surveyed their preferred snack choice. The table below shows the results of the survey.
| Preferred Snack Choices of Students at Sujata's School | ||
| Boys | Girls | |
| Candy | ||
| Chips | ||
| Chocolate bars | ||
| Cookies | ||
| Fruit | ||
| Ice cream | ||
| Popcorn | ||
| Pastry | ||
Which snack foods were preferred by more girls than boys?
Sujata had sampled an equal number of boys and girls at her school when she surveyed their preferred snack choice. The table below shows the results of the survey.
| Preferred Snack Choices of Students at Sujata's School | ||
| Boys | Girls | |
| Candy | ||
| Chips | ||
| Chocolate bars | ||
| Cookies | ||
| Fruit | ||
| Ice cream | ||
| Popcorn | ||
| Pastry | ||
Which snack food was preferred by considerably more boys than girls?
The following frequency table shows the transportation expenses of office executives on a particular day.
| Transportation expenses (in ) | Frequency |
Draw a histogram to represent the data.


