
Vistor Chow wal keung and RC Yadav Solutions for Chapter: Data Handling and Graphs, Exercise 9: EXERCISE
Vistor Chow wal keung Mathematics Solutions for Exercise - Vistor Chow wal keung and RC Yadav Solutions for Chapter: Data Handling and Graphs, Exercise 9: EXERCISE
Attempt the free practice questions on Chapter 17: Data Handling and Graphs, Exercise 9: EXERCISE with hints and solutions to strengthen your understanding. CPA Maths - A Singapore Approach solutions are prepared by Experienced Embibe Experts.
Questions from Vistor Chow wal keung and RC Yadav Solutions for Chapter: Data Handling and Graphs, Exercise 9: EXERCISE with Hints & Solutions
The pie chart shows how some students travel from home to school.
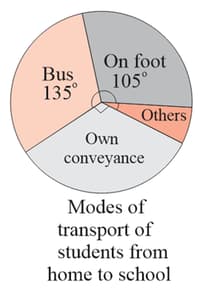
By which mode do most of the students travel from home to school?
The pie chart shows the favourite subjects of students.
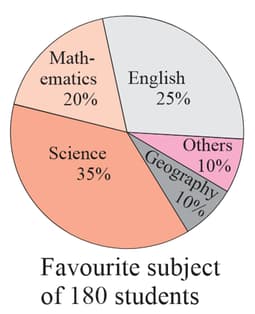
Which subject do most students like?
The pie chart shows the favourite subjects of students.

Find the number of students whose favourite subject is 'English'.
A shop sells three grades of coffee, which are Platinum, Gold and Silver. The pie chart represents the weight (in ) of each grade of coffee sold on a particular day. The total weight of coffee sold was .
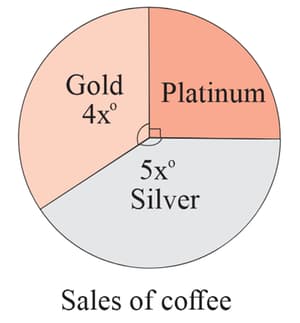
Find the value of .
The pie chart shows the proportions of students by age in a class. There are students who are years old.
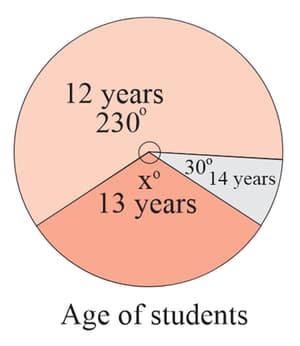
Find the value of ,
The pie chart shows the proportions of students by age in a class. There are students who are years old.

Find the total number of students in the class,
The pie chart shows the proportions of students by age in a class. There are students who are years old.

Find the number of students who are years old.


