
West Bengal Board Solutions for Chapter: Data Handling and Analysis, Exercise 5: Let's Work out - 13
West Bengal Board Mathematics Solutions for Exercise - West Bengal Board Solutions for Chapter: Data Handling and Analysis, Exercise 5: Let's Work out - 13
Attempt the practice questions on Chapter 13: Data Handling and Analysis, Exercise 5: Let's Work out - 13 with hints and solutions to strengthen your understanding. GANITPRABHA (MATHEMATICS TEXT BOOK) CLASS 6 solutions are prepared by Experienced Embibe Experts.
Questions from West Bengal Board Solutions for Chapter: Data Handling and Analysis, Exercise 5: Let's Work out - 13 with Hints & Solutions
Below is the weight of students of class of Soham's school.
Using the above raw data, let's prepare a frequency distribution chart.
From a survey conducted on students in a school, it is seen how many students like to study what subject. The raw data from the survey is given below:
| Subject | No. of students |
| Bengali | |
| Maths | |
| English | |
| Environment | |
| Hand Work |
Taking students, let's prepare a bar diagram.
Ram Da has a shop selling bags in Haldar Para. Ram Da himself makes the bags. Here a list of bags sold from the shop this week.
| Day | Monday | Tuesday | Wednesday | Thursday | Friday | Saturday |
| No. of bags sell. |
Draw a bar diagram.
A bar diagram shows the numbers of students appearing at the Madhaymik Examination each year during the last years.
Answer the below question by using the bar diagram.

Determine in which year the maximum number of students have appeared for the exam?
A bar diagram shows the numbers of students appearing at the Madhymik Examination each year during the last years.
Answer the below question by using the bar diagram.

In which year the least number of students have sat for the exam?
A bar diagram shows the numbers of students appearing at the Madhymik Examination each year during the last years.
Answer the below question by using the bar diagram.

How many more students have appeared for the examination in than ?
A bar diagram shows the numbers of students appearing at the Madhymik Examination each year during the last five years.
A set of questions is prepared from the bar diagram.
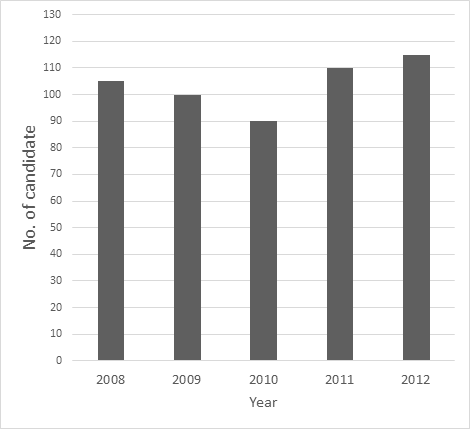
In , how many less students have appeared for the exam than in ?
A bar diagram shows the numbers of students appearing at the Madhymik Examination each year during the last five years.

How many total students have sat for the examination between and ?


