

Observe the above frequency polygon and find the classes having zero frequency.
Important Questions on Statistics
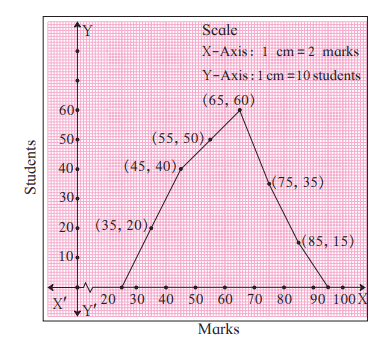
Observe the above frequency polygon and find the class-mark of the class having frequency of students.
Observe the frequency polygon and find the class mark of the class having a frequency of students.
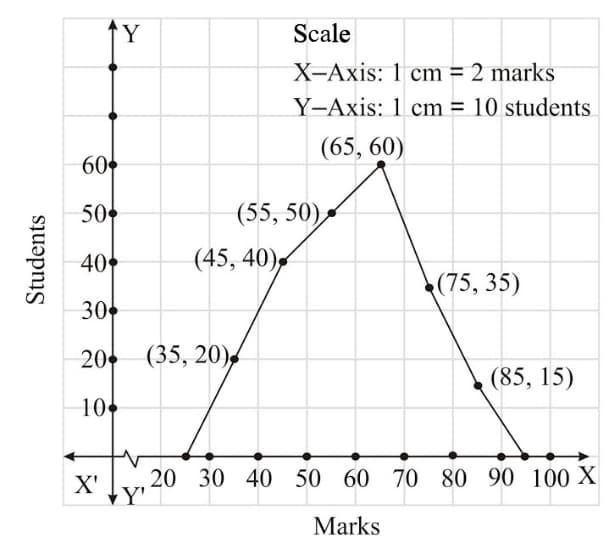
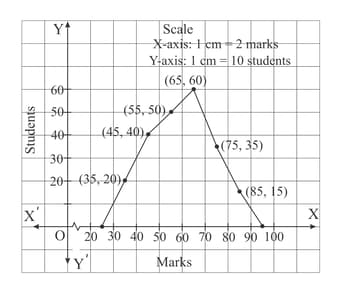
Observe the above frequency polygon and find the lower and upper class limits of the class whose class mark is .
The following table shows the classification of percentage of marks of students and the number of students. Draw a frequency polygon from the table.
| Result (Percentage) |
|||||||
| Number of students |
The age group and number of persons, who donated blood in a blood donation camp is given below. Draw a pie diagram from it.
| Age group (years) | ||||
| Number of persons |
The marks obtained by a student in different subjects are shown. Draw a pie diagram showing the information.
| Subject | English | Marathi | Science | Mathematics | Social science | Hindi |
| Marks |
In a tree plantation programme, the number of trees planted by students of different classes is given in the following table. Draw a pie diagram showing the information.
| Standard | th | th | th | th | th | th |
| Number of trees |
The following table shows the percentage of demands for different fruits registered with a fruit vendor. Show the information by a pie diagram.
| Fruits | Mango | Sweet lime | Apples | Cheeku | Oranges |
| Percentages of demand |


