
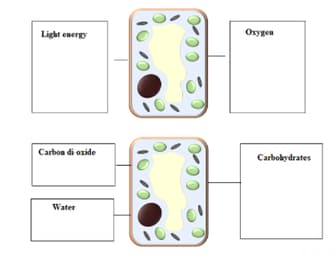
The figure shows a palisade cell. (It is a little unusual, as it has a strand of cytoplasm across the middle of the cell.)
Write short descriptions in each box, to explain how a palisade cell in a leaf gets what it needs for photosynthesis, and what happens to the products.
Use each of these words at least once.
(Airspace, diffusion, epidermis, osmosis, phloem, roothair, starch, stoma, sucrose, transparent, xylem)
Important Questions on Plant Nutrition
Some of the leaves on a tree spend most of the day in bright sunlight, while others are in the shade. The diagrams in Figure show sections through a leaf growing in the sunlight and a leaf growing in the shade.
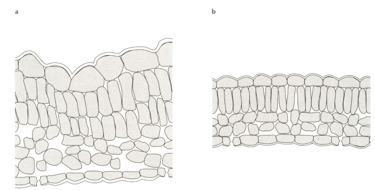
On the shade leaf diagram b, label these tissues:
lower epidermis, palisade mesophyll, spongy mesophyll, upper epidermis
Some of the leaves on a tree spend most of the day in bright sunlight, while others are in the shade. The diagrams in Figure show sections through a leaf growing in the sunlight and a leaf growing in the shade.
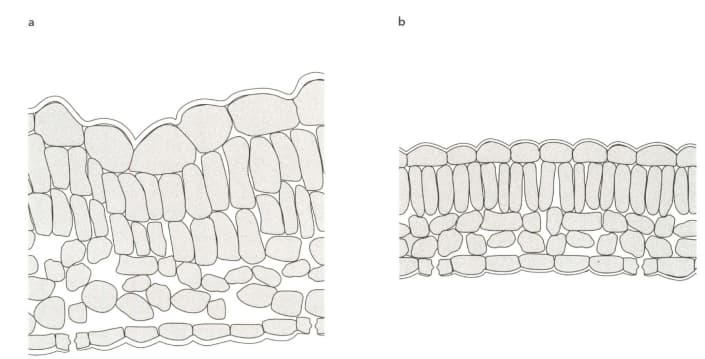
On the shade leaf diagram, draw a few green spots in each cell that you would expect to contain chloroplasts.
Complete the table to compare the structures of each of these parts of the leaves shown in Figure.
| Part of leaf | Sun leaf | Shade leaf |
| Cuticle | ||
| Palisade mesophyll | ||
| Spongy mesophyll |
| Part of leaf | Sun leaf | Shade leaf |
| Cuticle | Thicker | Thinner |
| Palisade mesophyll | ||
| Spongy mesophyll |
Suggest an explanation for the difference in the cuticle that you have described in the table
| Part of leaf | Sun leaf | Shade leaf |
| Cuticle | ||
| Palisade mesophyll | Longer | Shorter |
| Spongy mesophyll |
Suggest an explanation for the difference in the palisade layer that you have described in the above table
An experiment was performed to find out how fast a plant photosynthesised as the concentration of carbon dioxide in the air around it was varied. The results are shown in the table
| Percentage concentration of carbon dioxide | Rate of photosynthesis /arbitrary units |
| 0.00 | 0 |
| 0.02 | 33 |
| 0.04 | 53 |
| 0.06 | 68 |
| 0.08 | 79 |
| 0.10 | 86 |
| 0.12 | 89 |
| 0.14 | 90 |
| 0.16 | 90 |
| 0.18 | 90 |
| 0.20 | 90 |
Plot these results on the grid below and draw a line.
Explain why the rate of photosynthesis increases as carbon dioxide concentration increases.
The experiment was repeated at a lower light intensity. The results are shown in the table. Plot these values on your graph and draw a line. Label the two lines.
| Percentage concentration of carbon dioxide | Rate of photosynthesis /arbitrary units |
| 0.00 | 0 |
| 0.02 | 20 |
| 0.04 | 29 |
| 0.06 | 35 |
| 0.08 | 39 |
| 0.10 | 42 |
| 0.12 | 45 |
| 0.14 | 46 |
| 0.16 | 46 |
| 0.18 | 46 |
| 0.20 | 46 |


