
(b) This diagram shows the experimental setup (left) used to analyse the spectrum of a sodium discharge lamp with a diffraction grating with lines , and the spectral lines observed (right) in the developed photographic film.
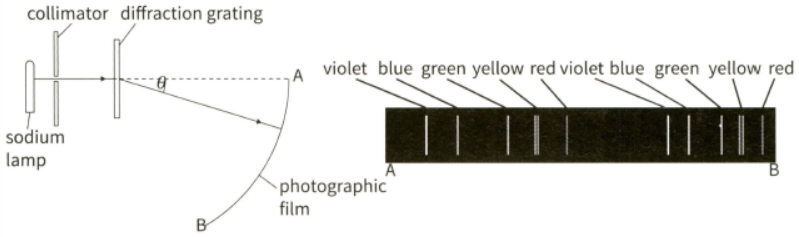
(i) Explain why two spectra are observed.
Important Questions on Superposition of Waves
(b) This diagram shows the experimental setup (left) used to analyse the spectrum of a sodium discharge lamp with a diffraction grating with lines , and the spectral lines observed (right) in the developed photographic film.

(ii) Describe two differences between these two spectra.
(b) This diagram shows the experimental setup (left) used to analyse the spectrum of a sodium discharge lamp with a diffraction grating with lines , and the spectral lines observed (right) in the developed photographic film.

(iii) The green maximum near end is at an angle of . Calculate the wavelength of the green light.
(b) This diagram shows the experimental setup (left) used to analyse the spectrum of a sodium discharge lamp with a diffraction grating with lines , and the spectral lines observed (right) in the developed photographic film.

(iv) Calculate the angle produced by the second green line.
(b) A student sets up an experiment to investigate the interference pattern formed by microwaves of wavelength . The apparatus is set up as in Figure. The distance between the centres of the two slits is . The detector is centrally placed from the metal plates where it detects a maximum. The student moves the detector across the bench parallel to the plates. Calculate how many maxima the detector will be moved through.
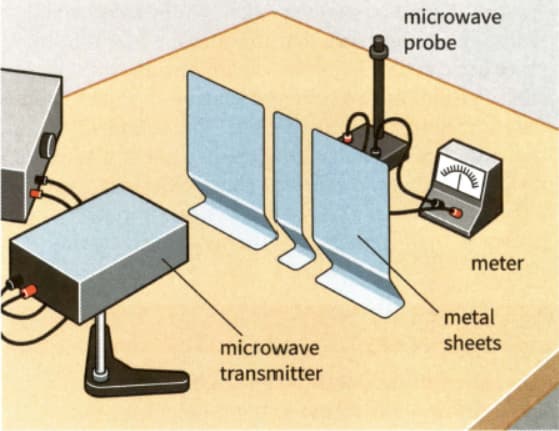
A student sets up an experiment to investigate the interference pattern formed by microwaves of wavelength . The apparatus is set up as in Figure. The distance between the centres of the two slits is . The detector is centrally placed from the metal plates where it detects a maximum. The student moves the detector across the bench parallel to the plates.

(a) Explain what is meant by the diffraction of a wave.
(b) This diagram shows waves, in a ripple tank, spreading out from two slits.
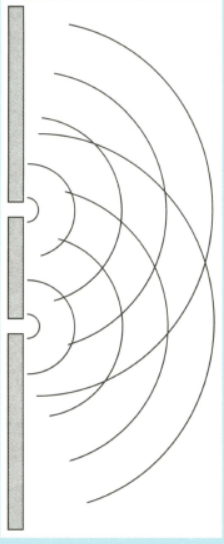
(i) a line showing points along the central maximum- label this line .


