
What is the relationship between coral and zooxanthellae?
Important Questions on Practice Exam Papers
Lettuce coral is the dominant coral species in shallow semi-exposed reefs in the Southern Caribbean Sea. Colonies of $U$. Tenuifolia were classified according to the colony size into small, medium and large. The number of colonies according to their size were recorded three times, starting in spring of the first year, then autumn of the first yea and ending in spring of the second year in a location in the Southern Caribbean. Describe the trends in numbers of colonies.

Lettuce coral is the dominant coral species in shallow semi-exposed reefs in the Southern Caribbean Sea. Colonies of $U$. Tenuifolia were classified according to the colony size into small, medium and large. The number of colonies according to their size were recorded three times, starting in spring of the first year, then autumn of the first year and ending in spring of the second year in a location in the Southern Caribbean. Suggest one reason for the change in population of small and medium corals.
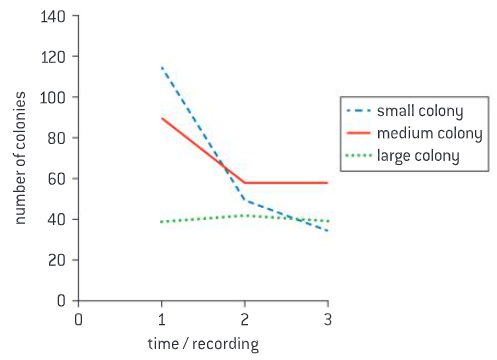
Lettuce coral (Undaria tenuifolia) is the dominant coral species in shallow semi-exposed reefs in the Southern Caribbean Sea. Colonies of $U$. tenuifolia were classified according to the colony size into small, medium and large. The number of colonies according to their size were recorded three times, starting in spring of the first year (1), then autumn of the first year (2) and ending in spring of the second year (3) in a location in the Southern Caribbean. Describe how bleaching is an indication of stress on corals.

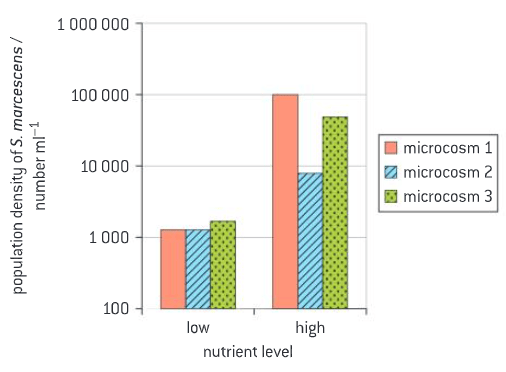
Serratia marcescens (first trophic level) is a bacterium eaten by Paramecium aurelia (second trophic level) which is eaten by a predator, Didinium nasutum (third trophic level). The effect of nutrients on this food chain was studied in three closed microcosms (small macrocosms). The microcosms were set up as follows at two different nutrient levels (low and high):
- microcosm. marcescens only
- microcosm . marcescens and P. aurelia only
- microcosm . marcescens, P. aurelia and D. nesutum.
The population density of the bacterium $S$. marcescens was measured after days.
State the effect of nutrient level on the density of population of S. marcescens in microcosm

Serratia marcescens (first trophic level) is a bacterium eaten by Paramecium aurelia (second trophic level) which is eaten by a predator, Didinium nasutum (third trophic level). The effect of nutrients on this food chain was studied in three closed microcosms (small macrocosms). The microcosm were set up as follows at two different nutrient levels (low and high):
— microcosm 1: S. marcescens only
— microcosm 2: S. marcescens and P. aurelia only
— microcosm 3: S. marcescens, P. aurelia and D. nasutum.
The population density of the bacterium $S$. marcescens was measured after days.
Explain the effect on the S. marcescens population density of adding a trophic level in each microcosm at a high nutrient level.

Serratia marcescens (first trophic level) is a bacterium eaten by Paramecium aurelia (second trophic level) which is eaten by a predator, Didinium nasutum (third trophic level). The effect of nutrients on this food chain was studied in three closed microcosms (small macrocosm). The microcosm were set up as follows at two different nutrient levels (low and high):
— microcosm 1: S. marcescens only
— microcosm 2: S. marcescens and P. aurelia only
— microcosm 3: S. marcescens, P. aurelia and D. nasutum.
The population density of the bacterium $S$. marcescens was measured after 7 days.
Suggest one reason for little change at low nutrient levels.

Serratia marcescens (first trophic level) is a bacterium eaten by Paramecium aurelia (second trophic level) which is eaten by a predator, Didinium nasutum (third trophic level). The effect of nutrients on this food chain was studied in three closed microcosms (small mesocosms). The microcosms were set up as follows at two different nutrient levels (low and high):
— microcosm 1: S. marcescens only
— microcosm 2: S. marcescens and P. aurelia only
— microcosm 3: S. marcescens, P. aurelia and D. nasutum.
The population density of the bacterium $S$. marcescens was measured after 7 days.
Using the data in this investigation, predict a relationship between nutrient levels and the length of a chain in a food web.
The table shows the number of plants of each species counted in a sand dune.
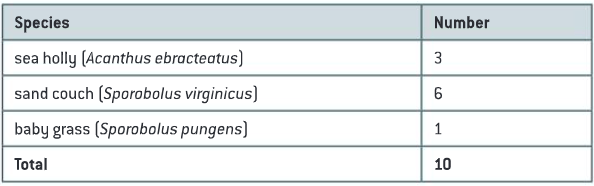
(a) Calculate the Simpson reciprocal diversity index from the following data for this community, using the formula given below.


