
Draw a graph for the following table of values, with suitable scales on the axes. Interest on deposits for a year:
Deposits (in )
Simple Interest (in
To get an interest of per year, how much money should be deposited?
Important Questions on Graphs
Draw the graph for the following.
| Side of square (in cm) | |||||
| Perimeter (in cm) |
Draw the graph for the following.
| Side of square (in ) | ||||||
| Area (in ) |
The adjoining figure shows a distance vs time graph. Read the graph and answer the question given below.
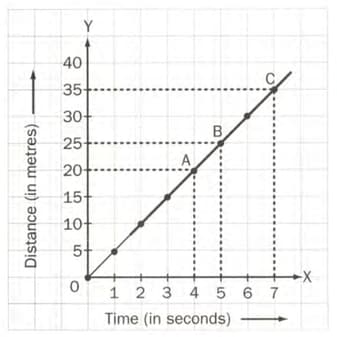
What is the distance covered when time is seconds?
The adjoining figure shows a distance vs time graph. Read the graph and answer the question given below.

What is the distance covered in seconds?
The adjoining figure shows a distance vs time graph. Read the graph and answer the question given below.
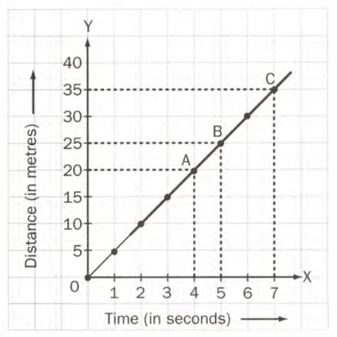
In how much time did the body covers ?
The following table gives the quantity of petrol and its cost.
| Number of litres of petrol | ||||
| Cost of petrol (in ) |
Plot the graph to show the data.
A bank gives simple interest on deposits by senior citizens. Draw a graph to illustrate the relation between the sum deposited and simple interest earned. Find from your graph, the annual interest obtainable for an investment of .
A bank gives simple interest on deposits by senior citizens. Draw a graph to illustrate the relation between the sum deposited and simple interest earned. Find from your graph, the investment one has to make to get an annual simple interest of .


