
Which of the following statements is true about histograms?
Important Questions on Introduction to Graphs
Population of city A, B and C from
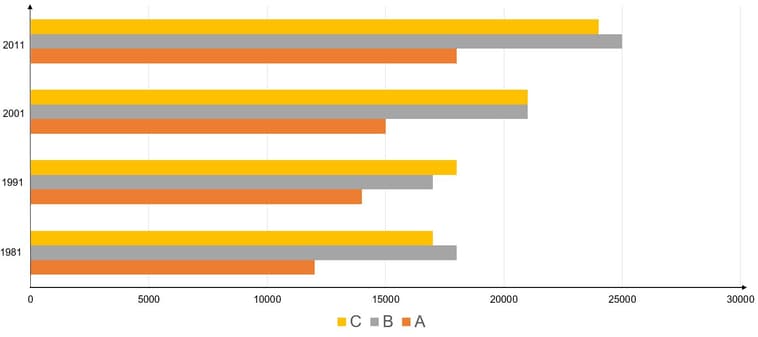
Choose the correct statement:
In a factory, there are workers who have been categorised into five groups () on the basis of the range of their daily wages (in multiples of ). The distribution is presented through a Histogram shown below:
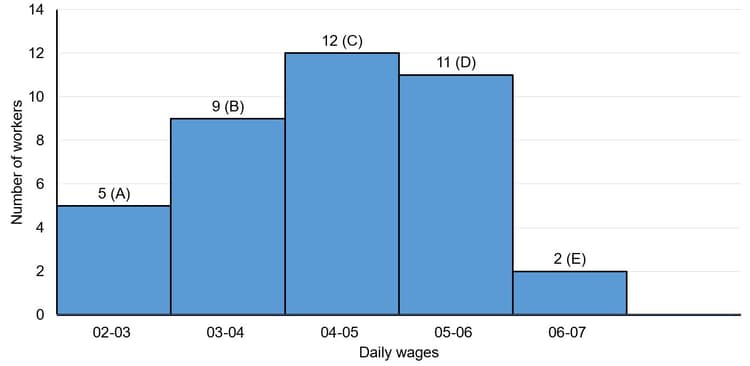
What is the ratio of the number of employees whose daily wages are or more but less than to that of the number of employees whose daily wages are or more but less than ?
The given graph shows the weights of students in a school on a particular day.
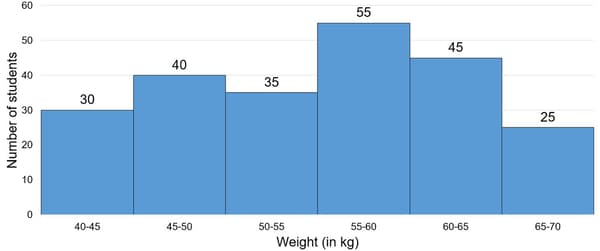
The number of students weighing less than is what percent less than the number of students weighing or more?
The modal class of the frequency distribution given below is _____.
| Class | |||||
| Frequency |
Study the graph and answer the question,
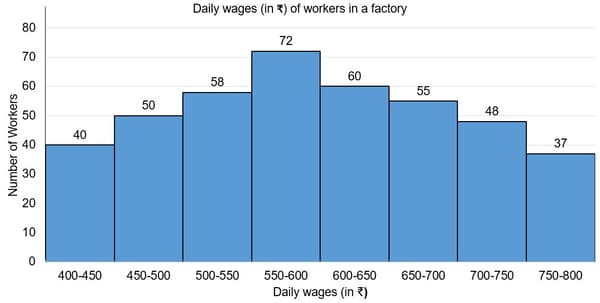
The number of workers in the factory whose daily wages are or more but less than is:
The given graph shows the marks obtained by the students in an examination.
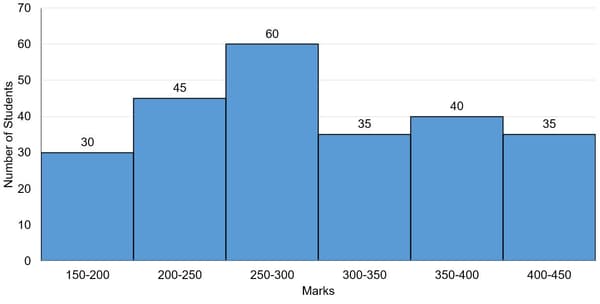
The numbers of students who obtained less than marks is what percent more than the number of students who obtained or more marks?
The expenditure of a municipal corporation of a city in different sectors is given below:
| Sector | Expenditure (in Lakh) |
| Education | |
| Health services | |
| Beautification | |
| Surface transport | |
| Others |
Draw a pie-chart to represent the above data.
The monthly consumption of electricity (in units) of some families of a locality is given in the following frequency distribution:
| Monthly Consumption (in units) | |||||||
| Number of Families |
Prepare a ‘more than type’ ogive for the given frequency distribution.
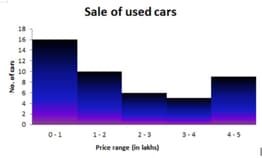
Christo collected details of a dealer who sells used cars of different ranges. What is the price range of the minimum number of cars sold?
The heights of girls of Class of a school are recorded as follows:
| Height (in ) | ||||||
| No of Students |
Draw a ‘more than type’ ogive for the above data.
Draw a histogram for the given data, using the frequency table and answer the following question.
The weekly wages (in ) of workers in a factory are.
Which group has the maximum number of workers?
During the medical check-up of students of a class, their weights were recorded as follows:
| Weight (in ) | Number of students |
| Less than | |
| Less than | |
| Less than | |
| Less than | |
| Less than | |
| Less than | |
| Less than | |
| Less than |
Draw a less than type ogive for the given data. Hence, obtain the median weight from the graph verify the result by using the formula.
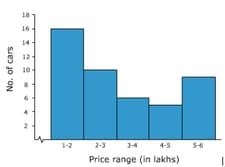
Christo collected details of a dealer who sell used cars of different ranges. What is the price range of the maximum number of cars sold?
The table given below shows the weekly expenditures on food of some households in a locality
| Weekly expenditure (in ) | Number of house holds |
Draw a ‘less than type ogive’ and a ‘more than type ogive’ for this distribution.
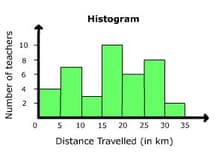
The histogram shows the distance travelled by all the subject teachers, everyday, from their house to school. If all the math teachers travel less than 20 km, then can you tell how many math teachers are there in the school?
Math scores of 28 students were recorded as follows.
They were also graded, based on their marks. Identify the correct histogram which represents the below given table.
|
No of Students |
6 |
7 |
10 |
5 |
|
Marks Scored |
60 – 70 |
70 – 80 |
80 – 90 |
90 - 100 |
|
Grades |
B |
B+ |
A |
O |
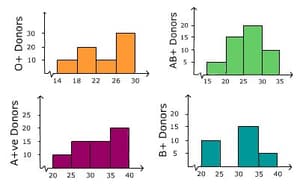
Mahesh’s father needs O + ve blood; from the given data can you tell us how many donors might be available to donate blood?
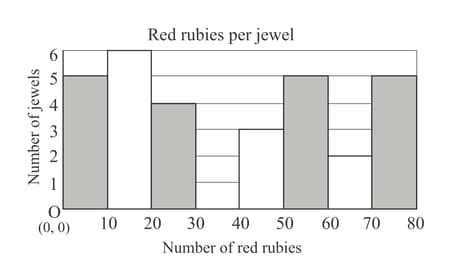
In an exhibition, Rekha counted all the jewellery items which had red rubies in them. According to the given histogram, there are _____ numbers of jewellery items which have red rubies in them.
Given below is the efficiency of the delivery bikes (in km/litre) of a particular pizza shop.
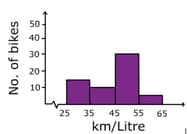
How many bikes have the highest efficiency?
The given table represents the runs scored by Vishal in his interschool cricket premier league.
35 | 23 | 80 | 76 | 111 |
57 | 43 | 15 | 63 | 82 |
0 | 12 | 101 | 2 | 11 |
67 | 125 | 58 | 14 | 97 |
53 | 73 | 89 | 42 | 8 |
Identify the correct histogram which represents the given table.


