children of class named their favourite fruits as follows.
Fruit
Tally marks
Number of children
Mango
Banana
Apple
Grapes
Represent the data on a bar graph. Paste coloured strips of paper, or draw bars on paper to make a bar graph.

Important Questions on Data Handling
children voted for the monitor of the class. The following results were obtained.
Salma, Anita, Rakesh, Rakesh, Rakesh, Anita, Salma, Anita, Salma, Rakesh,
Deepak, Anita, Rakesh, Deepak, Salma, Anita, Deepak, Anita, Rakesh, Anita,
Deepak, Salma, Anita, Salma, Anita, Rakesh, Rakesh, Deepak, Salma, Anita
| Name | Tally marks | Number of votes |
| Deepak | ||
| Anita | ||
| Rakesh | ||
| Salma |
children voted for the monitor of the class. The following results were obtained.
| Name | Tally marks | Number of votes |
| Deepak | ||
| Anita | ||
| Rakesh | ||
| Salma |
Looking at the tally marks table answer the following question.
Who was elected as the monitor?
children voted for the monitor of the class. The following results were obtained.
| Name | Tally marks | Number of votes |
| Deepak | ||
| Anita | ||
| Rakesh | ||
| Salma |
Looking at the tally marks table answer the following question.
How many votes did the monitor get?
children voted for the monitor of the class. The following results were obtained.
| Name | Tally marks | Number of votes |
| Deepak | ||
| Anita | ||
| Rakesh | ||
| Salma |
Looking at the tally marks table answer the following question.
How many more votes did the monitor get from his/her nearest rival?
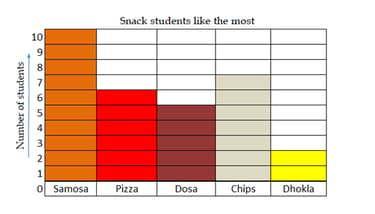
students of Class B were asked about the snack they like the most.
The bar graph shows the number of students who like different snacks.

Study the bar graph and answer the following question.
Which is the most popular snack?
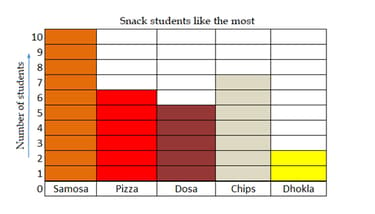
students of Class B were asked about the snack they like the most.
The bar graph shows the number of students who like different snacks.

Study the bar graph and answer the following question.
How many students like pizza the most?
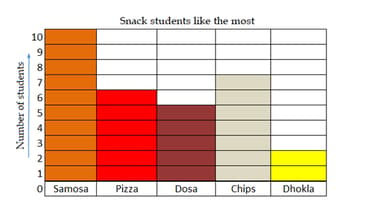
students of Class B were asked about the snack they like the most.
The bar graph shows the number of students who like different snacks.

Study the bar graph and answer the following question.
How many more students like dosa than dhokla?
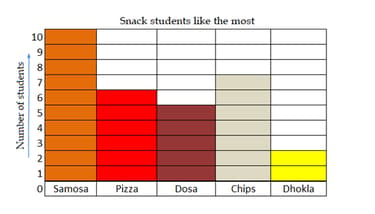
students of Class B were asked about the snack they like the most.
The bar graph shows the number of students who like different snacks.

Study the bar graph and answer the following question.
girls chose samosa as their favourite. How many boys chose samosa as their favourite snack?
