
A TV channel organized a SMS (Short Message Service) poll on prohibition of smoking, giving options like complete prohibition, prohibition in public places only, not necessary. SMS results in one hour were
Represent the above data as a grouped frequency distribution table. How many appropriate answers were received? What was the majority of people's opinion?
Important Questions on Data Handling and Presentation
Find the value of in following table.
| Term | Frequency | Cumulative Frequency |
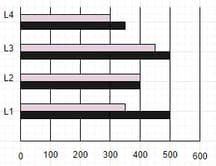
The bar chart represents number of fiction and non-fiction books in four libraries L1, L2, L3 and L4. Consider the bar chart and answer the question based on it:

| L1 | L2 | L3 | L4 | |
| Non-Fiction (Pink) | 350 | 400 | 450 | 300 |
| Fiction (Black) | 500 | 400 | 500 | 350 |
The ratio of total books of libraries L1 and L3 to L2 and L4 is:
| Class | |||||
| Frequency |
The cumulative frequency of the class of the above frequency distribution is _____.
The bar chart represents number of fiction and non-fiction books in four libraries L1, L2, L3 and L4. Consider the bar chart and answer the question bsed on it -

| L1 | L2 | L3 | L4 | |
| Non-Fiction (Pink) | 350 | 400 | 450 | 300 |
| Fiction (Black) | 500 | 400 | 500 | 350 |
What is the percentage difference of total number of fiction books in libraries L3 and L4 to the non-fiction books in L3 and L4?
.
.
.
. It is the same
The fasting blood sugar level () and the postprandial blood sugar level () of a patient was monitored for four weeks and , and the readings (in ) for the four weeks are as follows:
These have been presented through a bar graph. The normal range is considered to be:
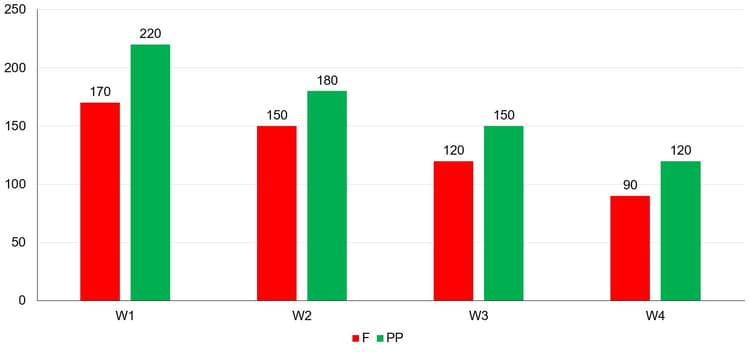
During which week was the fasting blood sugar level of the patient approximately above the upper limit of normal blood sugar level?
Direction: Study the graph carefully to answer these question.
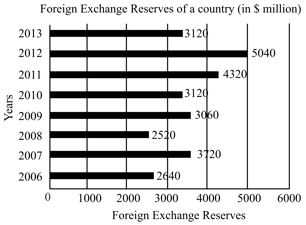
What is the percentage increase in the foreign reserves in over ?
The given table represents the exports (in ₹ crores) of four items A, B, C and D over a period of six years. Study the table and answer the question that follows.
|
Items Year |
A | B | C | D |
In which year, the exports of item were the average exports of item during six years;
Direction: Study the graph carefully to answer these question.

The foreign exchange reserve in was how many times that in ?
The bar chart represents number of fiction and non-fiction books in four Libraries . Consider the bar chart and answer the question based on it.
| Non-Fiction (Pink) | ||||
| Fiction (Black) |
The ratio of total number of non-fiction to fiction books in all libraries is-
1.
2.
3.
4.
The graph below shows three types of grains produced(in tonnes) in four states A, B, C and D.
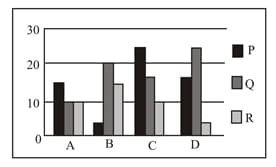
What percentage of grain Q is produced by state D out of the total quantity of Q produced by all states?
The given histogram shows the frequency distribution of the speed of cars passing through a particular spot on a highway. Read the graph and answer the following question.
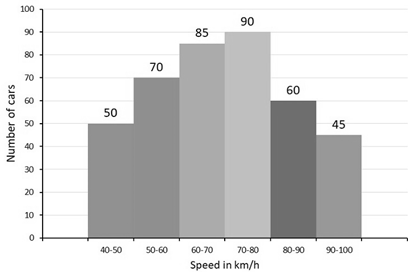
The number of cars with speed () in the interval () is what percentage less than the number of cars with speed () in the interval () ? (Correct to one decimal point)
The number of students in Class in Science, Arts and Commerce streams of a school over a period of years () has been depicted through the bar chart given below:
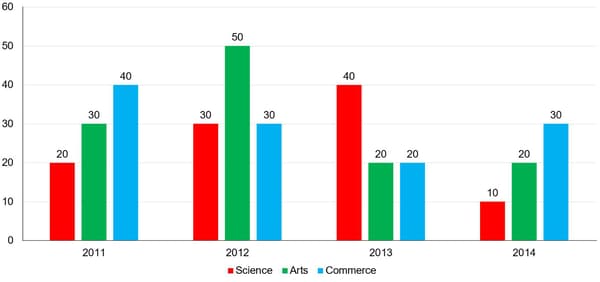
What is the difference between the averages of the number of Science and Commerce students in the given class over the given period of years?
The table below shows, children of a class sorted according to their marks in an examination.
| Marks | Number of children |
If we arrange the children from the one with the least mark to the one with the greatest, then what will be the assumed mark of the student?
The given table represents the exports ( incrores) of four items and over a period of six years. Study the table and answer the question that follows:
| Items | ||||
| Years | ||||
The total exports of item from to is what percentage less than the total exports of all the four items in :(Correct to one decimal place)
The following table gives the frequency of vowels used in the page of a book.
| Vowels | a | e | i | o | u |
| Frequency |


