
A graph displays data, which changes continuously over period of time.
Important Questions on Introduction to Graphs
Mr. Adam fell sick and his doctor maintained a record for his body temperature taken every four hours. It is shown in the given time-temperature graph.
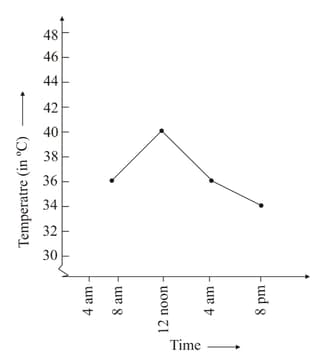
Observe the above and answer the following question.
At what time the temperature was highest?
Mr. Adam fell sick and his doctor maintained a record for his body temperature taken every four hours. It is shown in the given time-temperature graph.
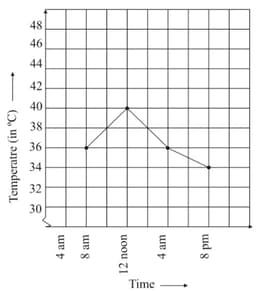
Observe the above and answer the given question.
At temperature was lowest. Find the value of
Mr. Adam fell sick and his doctor maintained a record for his body temperature taken every four hours. It is shown in the given time-temperature graph.
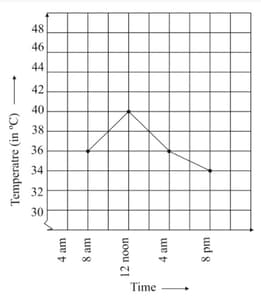
Observe the above and answer the following question.
During which period the temperature show a rising trend?
Mr. Adam fell sick and his doctor maintained a record for his body temperature taken every four hours. It is shown in the given time-temperature graph.
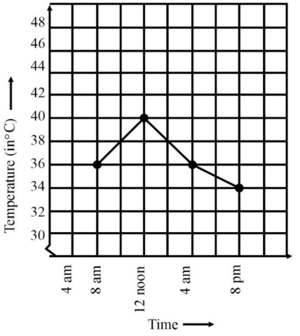
Observe the above and answer the following question.
During which period the temperature showed a downward trend? ()
The following line graph represents the total runs scored by two batsmen during each of the ten different matches in the year.
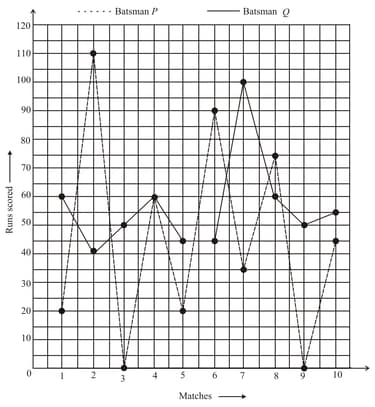
The horizontal axis (or the -axis) indicates the matches played during the year .
The _____ axis (or the -axis) shows the total runs scored in each match.
The following line graph represents the total runs scored by two batsmen during each of the ten different matches in the year.
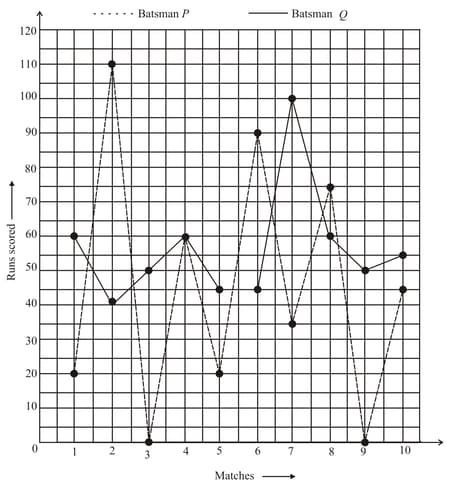
Observe the above line graph and fill in the blanks.
During the _____ match. Both have scored runs each. (st/th/th)
(This is indicated by the point at which both graphs meet).
The following line graph represents the total runs scored by two batsmen during each of the ten different matches in the year.
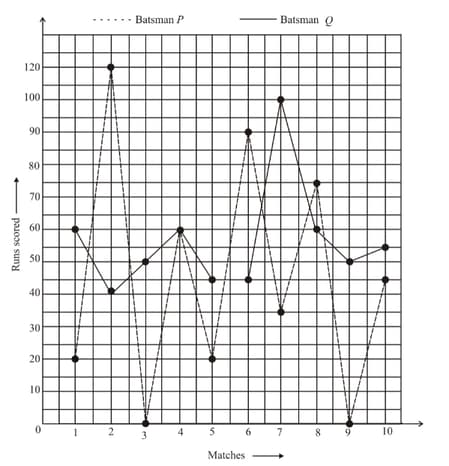
Observe the above line graph and fill in the blanks.
Batsman _____ has one great 'peak' but many deep 'valleys'.


