A ball is dropped from some height. After rebounding from the floor it ascends to the same height. Draw the velocity-time graph for the given motion.
Important Questions on Velocity and Acceleration
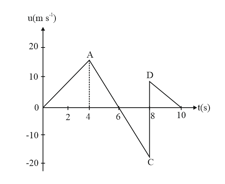
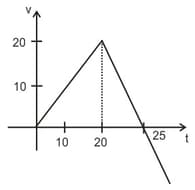
The following figure shows the speed-time graph of a particle moving along a fixed direction. The distance travelled by the particle between time to is
A particle starts from the origin at time and moves along the positive axis. The graph of velocity with respect to time is shown in figure. What is the position of the particle at time
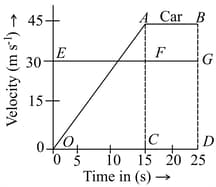
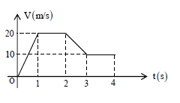
The velocity time graphs of a car and a scooter are shown in the figure. (i) The difference between the distance travelled by the car and the scooter in 15 s and (ii) the time at which the car will catch up with the scooter are, respectively.
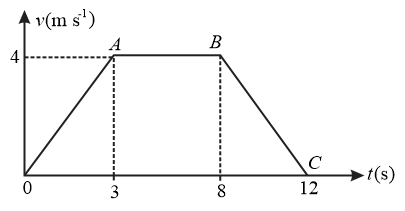
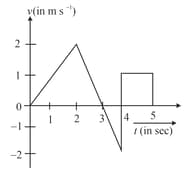
The velocity-time graph of a body moving in a straight line is shown in figure. Find the displacement and distance travelled by the body in seconds.
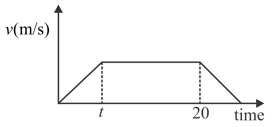
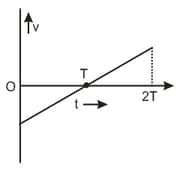
The velocity and time graph of a body in a straight line motion is shown in the figure. The point is at seconds. The total distance covered by the body in is :
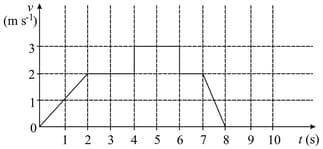
From the velocity-time graph, given in figure of a particle moving in a straight line, one can conclude that:
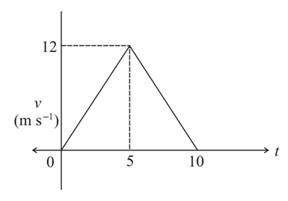
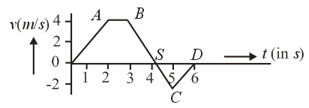
The fig. shows the v-t graph of a particle moving in straight line. Find the time (in seconds) when particle returns to the starting point.
The most probable velocity-time graph of the body is
The speed of a train increases at a constant rate from zero to and then remains constant for an interval and finally decreases to zero at a constant rate . The total distance travelled by the train is . The time taken to complete the journey is . Then,
The distance travelled with uniform velocity is
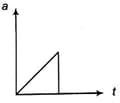
A car accelerates from rest at a constant rate for some time, after which it decelerates at a constant rate and comes to rest. If the total time elapsed is , then the maximum velocity acquired by the car is
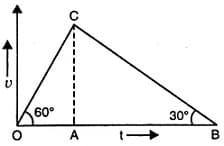
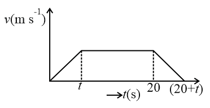
The velocity-time graph of a particle moving along a straight line is as shown in the diagram. The rate of acceleration and retardation is constant and is equal to . If the average velocity during the motion is then the maximum velocity of the particle is