
A body moves with a velocity of for . Then its velocity increases uniformly to in next . Thereafter, its velocity begins to decrease at a uniform rate until it comes to rest after . From the velocity-time graph, find the total distance moved by the body in initial and initial and in the last .
Important Questions on Motion
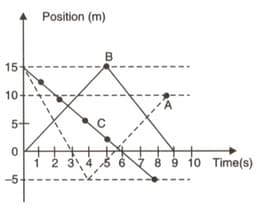
Discuss the graphs and shown in the figure. Compare the total distance travelled and the displacements. Which portion of graph represents a motion in which displacement is zero?
A sprinter in a race covers in first second, in next , in another and finishes the race in .
Calculate the average velocity of the sprinter. You may assume that during any given time interval the velocity is uniform.
A sprinter in a race covers in first second, in next , in another and finishes the race in .
In which time interval, is the average velocity attained by the sprinter maximum? State this velocity in appropriate units.
A sprinter in a race covers in first second, in next , in another and finishes the race in . Plot the distance-time graph for the motion of the sprinter. You may assume that during any given time interval the velocity is uniform. Find out the distance moved by the sprinter at the end of with the help of the graph.
A body moves with a velocity of for , then its velocity uniformly increases to for the next . Thereafter, its velocity begins to decrease at a uniform rate until it comes to rest after .
(a) Plot a graph and graph for the motion of the body.
(b) Mark the portions of the graph when the motion is uniform and when it is non-uniform.
(c) From the graph find the total distance moved by the body in
- first
- first and
- in the last
Interpret the following figure which shows position of bodies and at different instants of time. Draw a graph of position versus time and answer the following question:

What were the positions of and at ?
Interpret the following figure which shows position of bodies and at different instants of time. Draw a graph of position versus time and answer the following question:
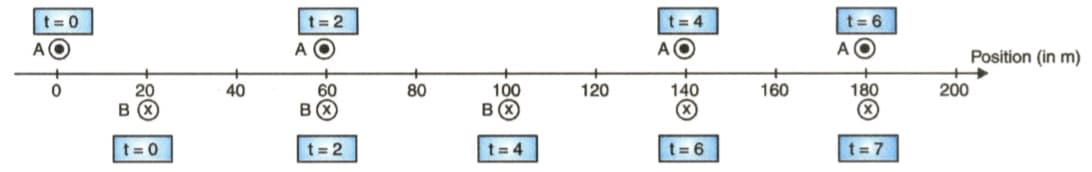
Who overtakes whom on the road?
Interpret the following figure which shows position of bodies and at different instants of time. Draw a graph of position versus time and give answer of the following question:

What is the speed of .


