
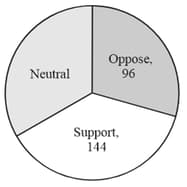
A campus poll covering undergraduate students was conducted in order to study the students' attitudes towards a proposed change in the rules for hostel accommodation. The students were required to respond as 'support','neutral' or 'oppose' with regard to the issue. The poll outcome was presented as a pie chart as given. The numbers for 'support', 'neutral' and 'oppose' are respectively
Important Questions on General Mental Ability (Quantitative Aptitude /Reasoning)
The following tables show the expenditure (in percentage) of two families A and B. Which one among the following statement is true?
| Family A (Monthly income) | |
| Miscellaneous | |
| Entertainment | |
| Food | |
| Family B (Monthly income) | |
| Entertainment | |
| Miscellaneous | |
| Food | |
Consider the following pie graph depicting the budget of a family.
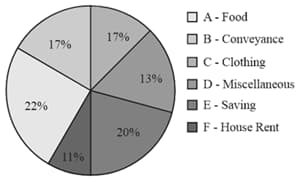
How many degrees difference be there in the central angle of the sector for saving and miscellaneous expenses?
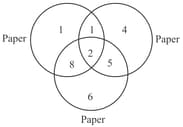
The number of persons reading newspaper is shown in the following Venn diagram (Survey of persons).
 .
.
In a population of , what is the number of the person expected to read at least two newspaper?
In the diagram given below, there is a circle, a square and a triangle dividing the region into five disjoint bounded areas. Each of these areas is labelled with the number of players belonging to that area. The circle contains cricketers, the square contains football players and the triangle contains hockey players.
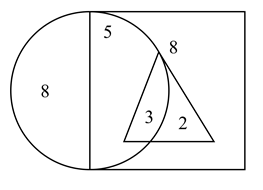
Which one of the following is not correct?
In a school, there are three batches of players, who play cricket, football and hockey. An incomplete chart of number of students playing an individual sport belonging to an individual batch is displayed in the following table.
| Batch I | Batch II | Batch III | Total | |
| Cricket Players | ||||
| Football Players | ||||
| Hockey Players | ||||
| Total |
Which one of the following is correct?


