
A circle graph is also called
.
Important Questions on Data Handling
The total angle of _____ at the centre of a circle is divided as per the values of the components.
In a pie chart, the central angle for a component _____
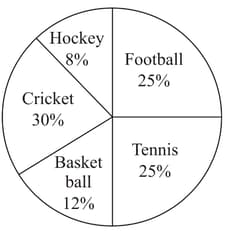
The following pie chart shows the different games played by the students of Class VIII.

Observe the above pie chart and answer the following question.
The most popular game among the students is _____ .
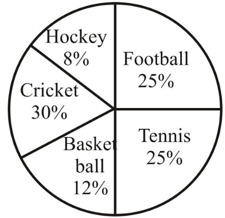
The following pie chart shows the different games played by the students of Class .
Observe the above pie chart and answer, the game played by least number of students is _____.
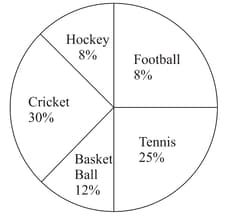
The following pie chart shows the different games played by the students of Class .
Observe the above pie chart and answer the question.(Cricket/Basketball/Tennis)
The game played by more number of students than hockey and less number of students than football, is _____.
On adding all the percentages in the given circle, we get sum as _____.
The data on the mode of transport used by students is given below.
Complete the following table and answer the questions that follow.
| S.No. | Mode of transport | Number of students | Central angle |
| (i) | Bus | ||
| (ii) | Cycle | ||
| (iii) | Train | ||
| (vi) | Car | ||
| (v) | Scooter |
What percentage of students use cycle as mode of transport?
The data on the mode of transport used by students is given below.
Complete the following table and answer the questions that follow.

Which mode of transport is used by the least number of students?. Also, find the percentage.


