
A class test was conducted for English. The marks obtained by students are given below.
Prepare a frequency table and answer the following question?
How many students got the same marks?
Prepare a frequency table and answer the following question?
Important Questions on Data Handling
A class test was conducted for English. The marks obtained by students are given below.
Prepare a frequency table and answer the following question?
How many students got first division marks?
A class test was conducted for English. The marks obtained by students are given below.
Prepare a frequency table and answer the following question?
How many students got distinction marks marks?
A class test was conducted for English. The marks obtained by students are given below.
Prepare a frequency table and answer the following question?
How many students appeared for the test?
Draw a pictograph for the following cars owned by the families in a particular locality.
| Cars | Maruti Alto | Hyundai I | Honda City | Toyota Etios | Mahindra Bolero |
| Number of families |
Answer the following question.
Which is the most popular car?
Draw a pictograph for the following cars owned by the families in a particular locality.
Cars Maruti Alto Hyundai Honda city Toyota Etios Mahindra Bolero
No. of families
| Cars | Maruti Alto | Hyundai I | Honda city | Toyota Etios | Mahindra Bolero |
| Number of families |
Answer the following question.
How many families are using Honda City?
Draw a pictograph for the following cars owned by the families in a particular locality.
| Cars | Maruti Alto | Hyundai I | Honda city | Toyota Etios | Mahindra Bolero |
| Number of families |
Draw a pictograph for the following cars owned by the families in a particular locality.
Answer the following question.
Which is the least popular car?
Read the pictograph showing different types of traffic at peak hour and answer the following question.
| Cycle |
|
| Scooter |  |
| Motorcycle |
|
| Car |  |
| Bus |
|


Each image represent vehicles in number.
What is the total number of vehicles running in peak hour?
Read the pictograph showing different types of traffic at peak hour.
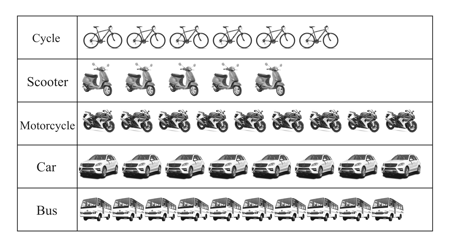
Each image represent vehicles in number. What is the most popular mode of transport? (Cycle/ Scooter/ Motorcycle/Car/Bus)


