
A factory worker is paid at a daily rate of per hour for the first forty hours of work per week and per hour for any extra time (overtime).
Write down an equation for the money earned during the first forty hours.
Important Questions on Modelling Relationships between Two Data Sets: Statistics for Bivariate Data
A factory worker is paid at a daily rate of per hour for the first forty hours of work per week and per hour for any extra time (overtime).
Write down an equation for the money earned on overtime.
A factory worker is paid at a daily rate of per hour for the first forty hours of work per week and per hour for any extra time (overtime).
Draw a graph for the wages earned during a hour working week.
A ski resort saw snow fall at a rate of per hour for the first two hours and then at per hour for the next three hours.
Draw a graph to show the snowfall.
A ski resort saw snow fall at a rate of per hour for the first two hours and then at per hour for the next three hours.
Draw a line on your graph to estimate when there will be of snow. Write your answer under the graph.Write down the maximum and minimum values that Pearson's product-moment correlation coefficient can take.
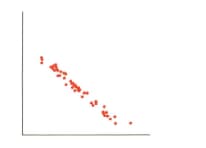
Choose two words from the list below which best describe the correlation between and in scatter diagram: perfect, zero, linear, strong positive, strong negative, weak positive, weak negative.
Kasem recorded the average monthly outside temperature in and the cost of his monthly electricity bill (in hundreds of Dirhams) over the course of six months. His results are shown in the table.
| Temperature | Electricity bills in |
Plot this data on a scatter diagram
Kasem recorded the average monthly outside temperature in and the cost of his monthly electricity bill (in hundreds of Dirhams) over the course of six months. His results are shown in the table.
| Temperature | Electricity bills in |
Find the mean outside temperature over the six months.


