
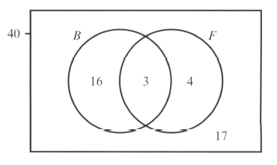
A group of students took a test in Economics. The following Venn diagram shows that boys took the test and that seven students failed the test
Describe the students who are members of the set .
Important Questions on Probability
A group of students took a test in Economics. The following Venn diagram shows that boys took the test and that seven students failed the test
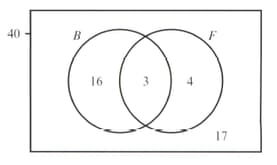
Find the probability that a randomly selected student is a boy or someone who failed the test.
The following table gives information about all the animals on a farm.
| Male | Female | |
| Goats | ||
| Sheep |
Find the probability that a randomly selected animal is:
male or a goat
The following table gives information about all the animals on a farm.
| Male | Female | |
| Goats | ||
| Sheep |
Find the probability that a randomly selected animal is:
a female or a sheep.
The following table gives information about all the animals on a farm.
| Male | Female | |
| Goats | ||
| Sheep |
a male or goat and a sheep or female.
Find a different way of describing each of the two types of animal.
Two ordinary fair dice are rolled and three events are:
the sum of the two numbers rolled is
: the difference between the two numbers rolled is zero.
: both of the numbers rolled are even.
List the outcomes that are favourable to:
and
Two ordinary fair dice are rolled and three events are:
the sum of the two numbers rolled is
: the difference between the two numbers rolled is zero.
: both of the numbers rolled are even.
List the outcomes that are favourable to:
and
Two ordinary fair dice are rolled and three events are:
the sum of the two numbers rolled is
: the difference between the two numbers rolled is zero.
: both of the numbers rolled are even.
List the outcomes that are favourable to:
and
Two ordinary fair dice are rolled and three events are:
the sum of the two numbers rolled is
: the difference between the two numbers rolled is zero.
: both of the numbers rolled are even.
List the outcomes that are favourable to:
What do your answers tell you about the events and ?


