
A histogram is drawn for discrete data.
Important Questions on Data Handling
The table shows a frequency distribution of the life times of radio tubes tested at a company. With reference to this table determine the
Upper limit of the fifth class is?
| Life time (hours) | Number of tubes |

How many students were awarded merit, if the minimum marks required for it are ?
The histogram below shows the weights of newborn babies:
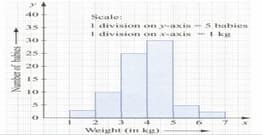
Find the ratio of the number of babies weighing or more but less than , to the number of babies weighing or more but less than .
The table shows a frequency distribution of the life times of radio tubes tested at a company. Determine the lower limit of the eighth class.
| Life time (hours) | Number of tubes |
If the minimum pass marks was , how many students failed?
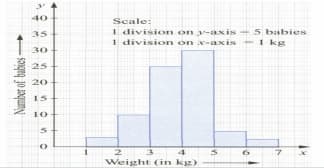
What percentage of babies have weight or more but less than
Find the class interval of
* The question given in the textbook is Incorrect, so the modified question is as follow
Find the size of the class intervals :
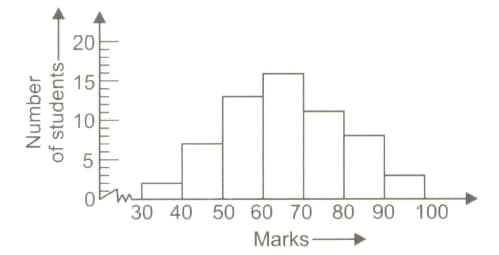
What is the total number of students who obtained more than or equal to marks in the examination?
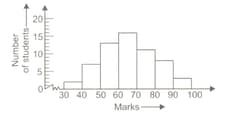
The number of hours for which students of a particular class watched television during holidays is shown through the given graph.
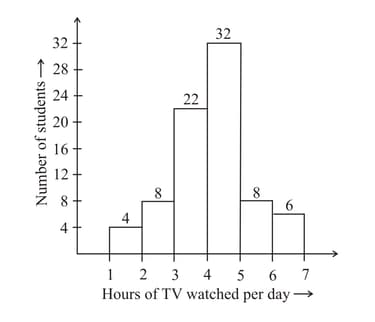
If the maximum number of students watch the TV for , then find the value of
Look at the given below data.
The frequency distribution of the data is given here.
| Group | Tally marks | Frequency |
| Group | Tally marks | Frequency |
Which of the above tables is the frequency table of the given data?
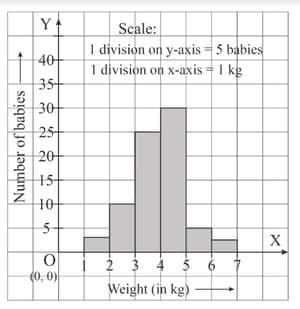
How many babies weigh kg or above?


