
A list of mountain peaks and their corresponding heights are given in the chart. Let us prepare a bar graph in a squared paper taking .
Name of mountain peak
Godwin Austin
Kailash
Nandadevi
Annapurna
Hight (approx. metre)
Important Questions on Double Bar Graph
For students of class Vll and students of class Vlll, a list on their choice of games has been made. Let us express the data through double bar graph.
| Games | Cricket | Football | Swimming | Hockey | kho-kho |
| Number of students of class VII | |||||
| Number of students of class VIII |
Given below the data of the number of clay dolls and sola dolls, a potter in Krishnanagar has made in months. Let us express the data through double bar graph.
| Month | January | February | March | April | May |
| Number of clay dolls | |||||
| Number of sola dolls |
The number of boys and girls of Tarai Tarapada Higher secondary school, for five years has been listed below. Express these data as a double bar graph. We all know literacy rate has increased with time but let us find if the literacy rate of girls are more than boys, or they are still backward.
| Year | |||||
| Boys | |||||
| Girls |
After our first continuous assessment, we friends worked in a group to grasp the subjects learnt through practical applications and through different methods. We prepared a table of the percentage of marks obtained in two continuous assessments after the second assessment.
| My friends | Sumit | Rumki | Jahir | Merry | Joseph | Nazreen |
| First assessment | ||||||
| Second assessment |
Preparing the double bar graph, let us understand, how much the new method helped to improve and who improved most.
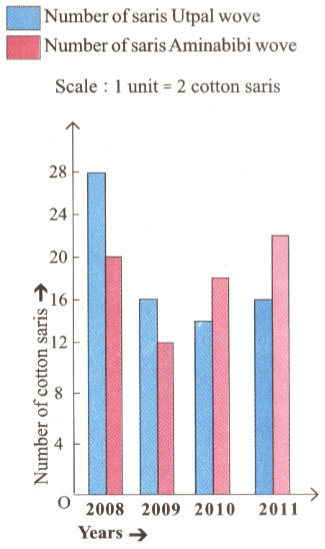
The yearly production of cotton saris woven by Utpal and Aminabibi from Phulia is shown in the double bar graph.

Answer the following question from the graph:
In which year did Utpal weave maximum number of saris and what is the number of saris woven. Again, in which year did he wove minimum number of saris and how many are those, let's find.
The yearly production of cotton saris woven by Utpal and Aminabibi from Phulia is shown in the double bar graph.

Answer the following question from the graph:
In which year did Aminabibi weave maximum number of saris and how many are those. Also in which year did she wove minimum number of saris and what is that number, let's find.
The yearly production of cotton saris woven by Utpal and Aminabibi from Phulia is shown in the double bar graph.
Answer the following question from the graph:
In which years did Utpal weave more saris than Aminabibi and in which year he wove maximum number of saris more than Aminabibi, let's find.
The yearly production of cotton saris woven by Utpal and Aminabibi from Phulia is shown in the double bar graph.

Answer the following question from the graph:
In which years did Aminabibi weave more number of saris than Utpal and in which year she wove maximum number of saris than Utpal, let's find.


