
A man is riding a bike at a uniform speed of . Plot a distance-time graph to show the relationship between distance and time. Is it a linear graph?
Important Questions on Introduction to Graphs
The line graph shows the temperature on four Sundays of three cities
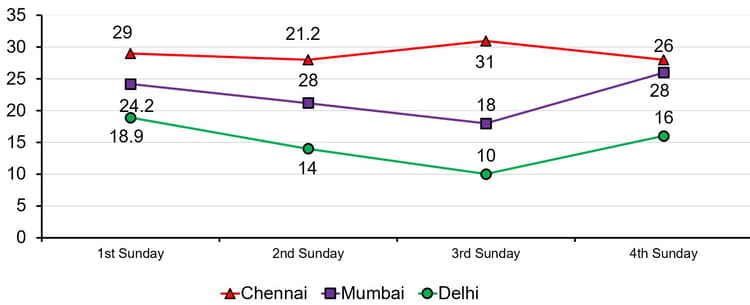
In the given line graph, what was the difference in temperature between Delhi and Chennai on the Sunday?
The line graph shows the production of A and B (in thousands) during the period to and the second line graph shows the percentage sale of these products.
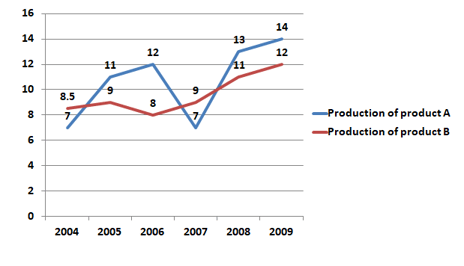
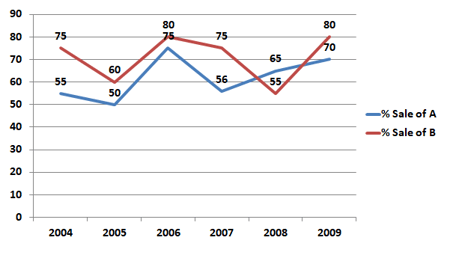
In the given line graph, what is the total sale of Product B in the year and together?
The line graph shows the temperature on four Sundays in three cities.
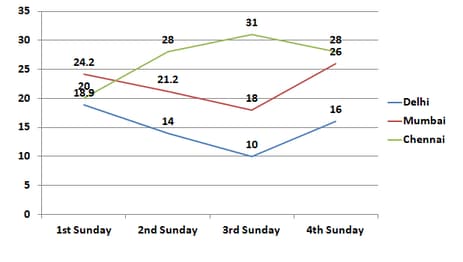
In the given line graph, when was the maximum temperature recorded in Chennai?
The line graph shows electricity consumption (in ) for three households A, B and C for months February to May.

In the given line graph, the percentage increase in electricity consumption of 'B' between March and May is:
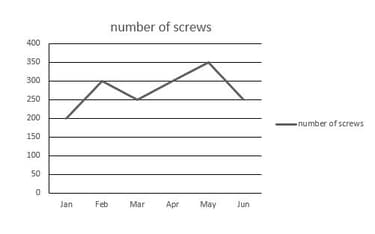
According to the chart below, in which month less than screws were manufactured?
The line graph shows the monthly expenditure by two families in hundreds:

In the given line graph, what is the difference in percentage of spending on food between family J and K?
The line graph shows the temperature on four Sundays of three cities

In the given line graph. What was the average temperature on the Sunday in all the three cities? (rounded to first decimal)
The line graph shows the temperature on four Sundays in three cities,

In the given line graph, when was the maximum temperature recorded in Delhi?
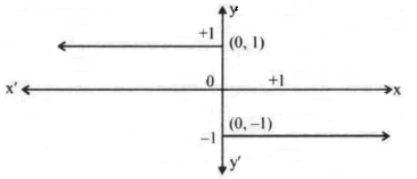
The equation of the graph shown here is:
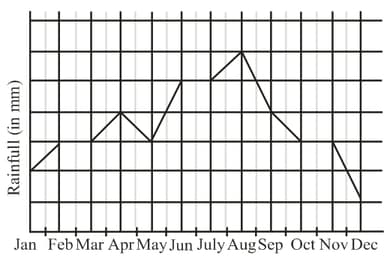
The above graph depicts the average monthly rainfall for a particular year in the country . Select the incorrect option :
The line graph shows electricity consumption (in ) for three households A, B and C for months February to May.
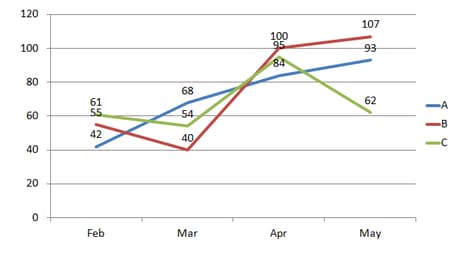
In the given line graph, the difference between the total electrical consumption between months of February and April is:
The line graph shows the monthly expenditure by two families in :
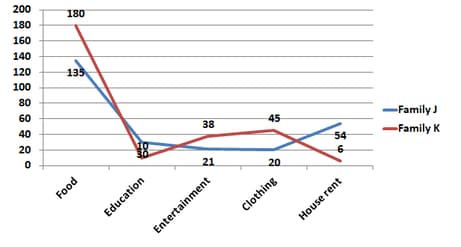
In the given line graph, what is the ratio of the difference in spending between food and education for family J and K?
The line graph shows the monthly expenditure by two families in :

In the given line graph, if the monthly income of Family K increases to . What will be the increase in expenditure on entertainment? (Assuming they spend the same proportion as before, round off to one decimal)
The line graph shows the temperature on four Sundays in three cities,
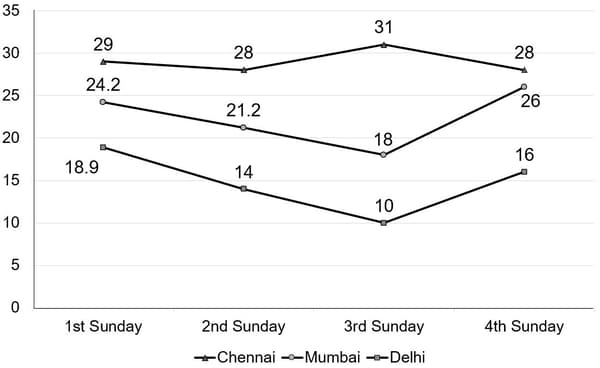
In the given line graph, what was the difference in temperature between Delhi and Mumbai on the Sunday?
The line graph shows the temperature on four Sundays of three cities.
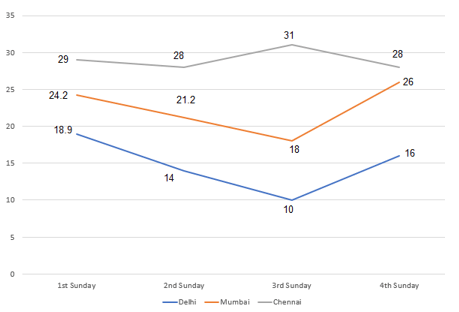
In the given line graph, what was the average temperature on the Sunday in all the three cities? (rounded to first decimal)
The line graph shows the production of product A and B (in ) during the period to and the second line graph shows the percentage sale of these products.
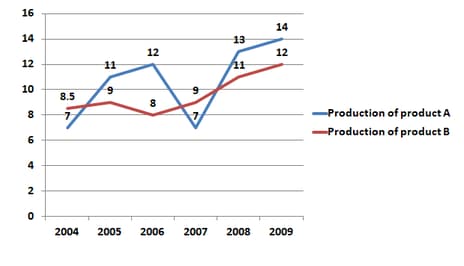

In the given line graph, what is the total sale of product A in the year and taken together?
The line graph shows the production of A and B (in thousands) during the period to and the second line graph shows the percentage sale of these products.

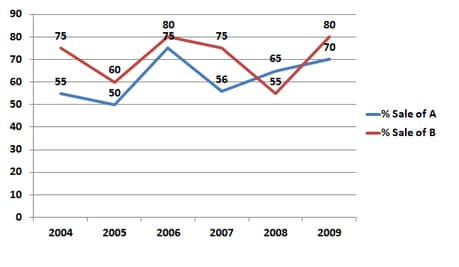
In the given line graph, what is the total sale of products A and B in the year
Write the coordinates of the point of intersection of the lines and .


