
MEDIUM
Earn 100
A photoelectric experiment is performed at two different light intensities and . Choose the correct graph showing the variation of stopping potential versus frequency of light.
50% studentsanswered this correctly
Important Questions on Modern Physics
MEDIUM
HARD
| 0.3 | 2.0 |
| 0.4 | 1.0 |
| 0.5 | 0.4 |
Given that Planck's constant (in units of ) found from such an experiment is :
MEDIUM
HARD
HARD
MEDIUM
In a photocell circuit, the stopping potential, is a measure of the maximum kinetic energy of the photoelectrons. The following graph shows experimentally measured values of stopping potential versus frequency, of incident light.
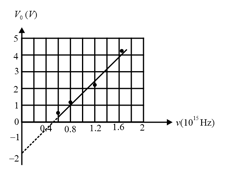
The values of Planck's constant and the work function as determined from the graph are (taking the magnitude of electronic charge to be,),
EASY
MEDIUM
MEDIUM
MEDIUM
MEDIUM
EASY
EASY
MEDIUM
MEDIUM
MEDIUM
MEDIUM
MEDIUM
MEDIUM
MEDIUM


