
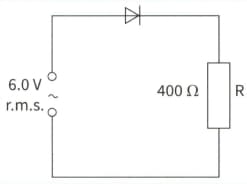
A sinusoidal voltage of 6.0 V r.m.s. and frequency 50 Hz is connected to a diode and a resistor R of resistance as shown in the diagram.

(b) An uncharged capacitor C is connected across R. When the 6.0V r.m.s. supply is switched on, the capacitor charges fully during the first quarter of a cycle. You may assume that the p.d. across the diode is zero when it conducts. For the next three-quarters of the first cycle, the diode stops conducting and the p.d. across R falls to one-half of the peak value. During this time the mean p.d. across R is 5.7V.
For the last three-quarters of the first cycle, calculate the time taken.
Important Questions on Alternating Currents
A sinusoidal voltage of 6.0 V r.m.s. and frequency 50 Hz is connected to a diode and a resistor R of resistance as shown in the diagram.
(b) An uncharged capacitor C is connected across R. When the 6.0V r.m.s. supply is switched on, the capacitor charges fully during the first quarter of a cycle. You may assume that the p.d. across the diode is zero when it conducts. For the next three-quarters of the first cycle, the diode stops conducting and the p.d. across R falls to one-half of the peak value. During this time the mean p.d. across R is 5.7V.
For the last three-quarters of the first cycle, calculate the mean current in R.
A sinusoidal voltage of 6.0 V r.m.s. and frequency 50 Hz is connected to a diode and a resistor R of resistance as shown in the diagram.

An uncharged capacitor C is connected across R. When the 6.0V r.m.s. supply is switched on, the capacitor charges fully during the first quarter of a cycle. You may assume that the p.d. across the diode is zero when it conducts. For the next three-quarters of the first cycle, the diode stops conducting and the p.d. across R falls to one-half of the peak value. During this time the mean p.d. across R is 5.7V. For the last three-quarters of the first cycle, calculate the charge flowing through R.
A sinusoidal voltage of 6.0 V r.m.s. and frequency 50 Hz is connected to a diode and a resistor R of resistance as shown in the diagram.

An uncharged capacitor C is connected across R. When the 6.0V r.m.s. supply is switched on, the capacitor charges fully during the first quarter of a cycle. You may assume that the p.d. across the diode is zero when it conducts. For the next three-quarters of the first cycle, the diode stops conducting and the p.d. across R falls to one-half of the peak value. During this time the mean p.d. across R is 5.7V.
For the last three-quarters of the first cycle, calculate the capacitance of C.
A sinusoidal voltage of 6.0 V r.m.s. and frequency 50 Hz is connected to a diode and a resistor R of resistance as shown in the diagram.

An uncharged capacitor C is connected across R. When the 6.0V r.m.s. supply is switched on, the capacitor charges fully during the first quarter of a cycle. You may assume that the p.d. across the diode is zero when it conducts. For the next three-quarters of the first cycle, the diode stops conducting and the p.d. across R falls to one-half of the peak value. During this time the mean p.d. across R is 5.7V.
Explain why the diode stops conducting during part of each cycle.
The rectified output from a circuit is connected to a resistor R of resistance . Graph A shows the variation with time of the p.d. V across the resistor. Graph B shows the variation of V when a capacitor is placed across R to smooth the output.
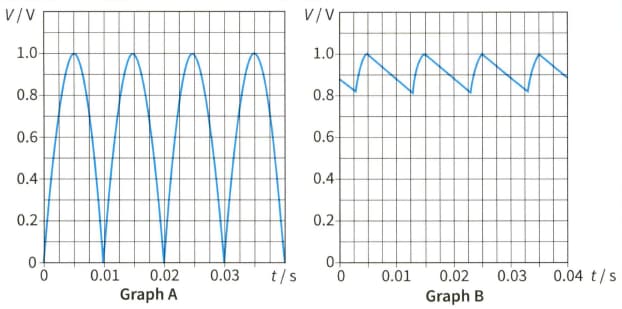
Explain how the rectification is achieved. Draw a circuit diagram to show the components involved. Explain the action of the capacitor in smoothing the output.
The rectified output from a circuit is connected to a resistor of resistance . Graph A shows the variation with time of the potential difference across the resistor. Graph B shows the variation of when a capacitor is placed across to smooth the output.

Explain how the rectification is achieved. Draw a circuit diagram to show the components involved. Using graph B between determine the time during which the capacitor is charging.
The rectified output from a circuit is connected to a resistor R of resistance . Graph A shows the variation with timet of the p.d. V across the resistor. Graph B shows the variation of V when a capacitor is placed across R to smooth the output.
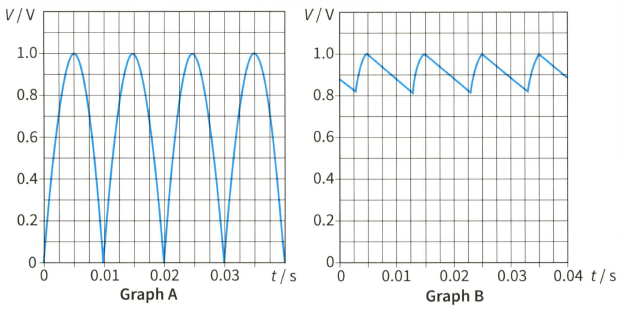
Explain how the rectification is achieved. Draw a circuit diagram to show the components involved.
(c) Using graph B between determine.
(ii) the mean value of the p.d. across R.
The rectified output from a circuit is connected to a resistor R of resistance . Graph A shows the variation with time of the p.d. V across the resistor. Graph B shows the variation of V when a capacitor is placed across R to smooth the output.

Explain how the rectification is achieved. Draw a circuit diagram to show the components involved. Using graph B between determine the average power dissipated in R.


