
A student creates a table to show the relationship between the side length of a square and its area.
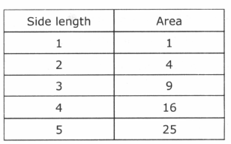
Which of the graphs below best represents this relationship?
Important Questions on Data Interpretation and Analysis
Consider the data set If you add to each of the values, then:
The graph depicts the link between mass and price of four different strawberry jam brands: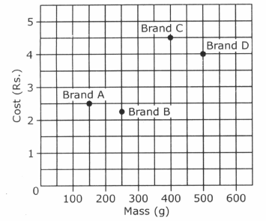
Which statement is true?
In an investigation, a student holds a motion detector, points it at a wall and walks towards the wall.
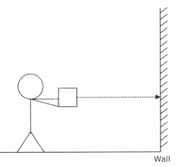
The student walks slowly at first and then speeds up as he approaches the wall. Which of the following graphs would be produced on the graphing calculator?
Rajnish is creating his own summer gardening job.
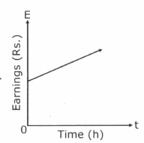
For each garden, he will charge an Rs. initial consultation fee plus Rs. per hour. Which graph best represents Rajnish's earnings for each garden?
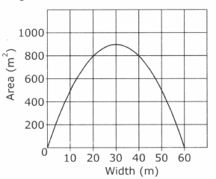
A rectangle is to have a perimeter of m. The graph below shows the relationship between the area of the rectangle and its width. What is the width of the rectangle with the largest area?
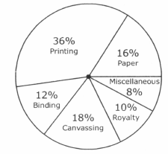
The chart shows the expenditure incurred in bringing out a book, by a publisher. What is the central angle showing the cost of paper?
The current plan for downloading music is made up of a flat fee of and a fee of per download. a new plan is made up of flat fee of and a fee of per download. which graph represents both plans?


