
A student measures the speed of the trolley as it moves down the slope. The variation of with time is shown in the graph.

Use the graph to find the velocity of the trolley, when
Important Questions on Accelerated Motion
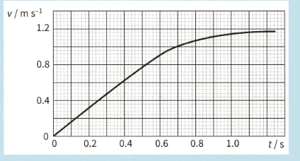
A student measures the speed of the trolley as it moves down the slope. The variation of with time is shown in the graph.

Show the acceleration of the trolley varies between . Explain your answer by reference to the graph.
A student measures the speed of the trolley as it moves down the slope. The variation of with time is shown in the graph.
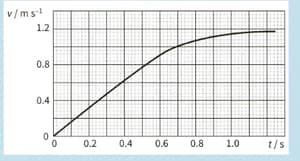
Determine the distance travelled by the trolley between .
A student measures the speed of the trolley as it moves down the slope. The variation of with time is shown in the graph.
The student obtained the reading for using a motion sensor. The readings may have random errors and systematic errors. Explain how these errors affect the velocity-time graph.
A car driving at speed on a straight road. He comes over a hill to find a tree fallen on the road ahead. He immediately breaks hard but travels a distance of at speed before the breaks are applied. The skid marks left on the road by the wheels of the car are of length as shown. The police investigate whether the driver was speeding and establish that the car decelerates at during the skid.

Determine the initial speed of the car before the breaks are applied.
A car driving at speed on a straight road. He comes over a hill to find a tree fallen on the road ahead. He immediately breaks hard but travels a distance of at speed before the breaks are applied. The skid marks left on the road by the wheels of the car are of length as shown. The police investigate whether the driver was speeding and establish that the car decelerates at during the skid.

Determine the time taken between the driver coming over the top of the hill and applying the breaks. Suggest whetherthis shows whether the driver was alert to the danger.
A car driving at speed on a straight road. He comes over a hill to find a tree fallen on the road ahead. He immediately breaks hard but travels a distance of at speed before the breaks are applied. The skid marks left on the road by the wheels of the car are of length as shown. The police investigate whether the driver was speeding and establish that the car decelerates at during the skid.
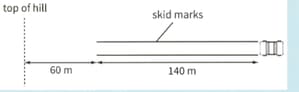
The speed limit on the road is . Determine whether the driver was breaking the speed limit.
A hot air balloon rises vertically. At time , a ball is released from the balloon. This graph shows the variation of the ball's velocity . The ball hits the ground at

Explain how the graph shows that the acceleration of the ball is constant.
A hot air balloon rises vertically.At time , a ball is released from the balloon. This graph shows the variation of the ball's velocity . The ball hits the ground at
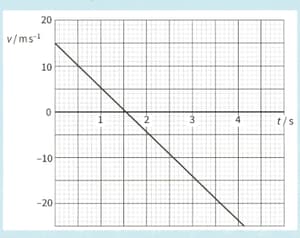
Determine the time at which the ball is reached its highest point


