
A student releases a toy car to roll down a ramp, as shown.
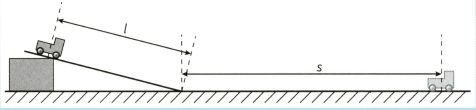
The student measures the distance from the middle of the car as it is released to the bottom of the ramp and the distance travelled along the straight section before the car stops. He also measures the time taken to travel the distance . He then repeats the experiment using a different value of .
The student obtained readings with and , taking each reading for and twice. The readings were:
: values for were ; values for were
values for were ; values for were .
(a) For the smaller value of , obtain a value for:
(iii) The average value of .
Important Questions on Practical Skills at AS Level
A student releases a toy car to roll down a ramp, as shown.
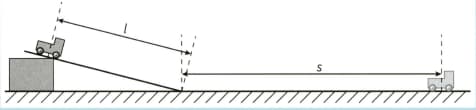
The student measures the distance from the middle of the car as it is released to the bottom of the ramp and the distance travelled along the straight section before the car stops. He also measures the time taken to travel the distance . He then repeats the experiment using a different value of .
The student obtained readings with and , taking each reading for and twice. The readings were:
: values for were ; values for were
values for were ; values for were .
(a) For the smaller value of , obtain a value for:
(iv) The absolute and percentage uncertainty in the value of .
A student releases a toy car to roll down a ramp, as shown.
The student measures the distance from the middle of the car as it is released to the bottom of the ramp and the distance travelled along the straight section before the car stops. He also measures the time taken to travel the distance . He then repeats the experiment using a different value of .
The student obtained readings with and , taking each reading for and twice. The readings were:
: values for were ; values for were
values for were ; values for were .
(b) (i) For both values of , calculate the average speed of the car along the straight section of track using the relationship .
A student releases a toy car to roll down a ramp, as shown.
The student measures the distance from the middle of the car as it is released to the bottom of the ramp and the distance travelled along the straight section before the car stops. He also measures the time taken to travel the distance . He then repeats the experiment using a different value of .
The student obtained readings with and , taking each reading for and twice. The readings were:
: values for were ; values for were
values for were ; values for were .
(b) (ii) Justify the number of significant figures that you have given for your values of .
A student releases a toy car to roll down a ramp, as shown.
The student measures the distance from the middle of the car as it is released to the bottom of the ramp and the distance travelled along the straight section before the car stops. He also measures the time taken to travel the distance . He then repeats the experiment using a different value of .
The student obtained readings with and , taking each reading for and twice. The readings were:
: values for were ; values for were
values for were ; values for were .
(c) (i) It is suggested that is proportional to . Explain whether the readings support this relationship.
A student releases a toy car to roll down a ramp, as shown.

The student measures the distance from the middle of the car as it is released to the bottom of the ramp and the distance travelled along the straight section before the car stops. He also measures the time taken to travel the distance . He then repeats the experiment using a different value of .
The student obtained readings with and , taking each reading for and twice. The readings were:
: values for were ; values for were
values for were ; values for were .
(c) (ii) (HARDER) It is suggested that is proportional to . Explain whether the readings support this relationship.
A student releases a toy car to roll down a ramp, as shown.
The student measures the distance from the middle of the car as it is released to the bottom of the ramp and the distance travelled along the straight section before the car stops. He also measures the time taken to travel the distance . He then repeats the experiment using a different value of .
The student obtained readings with and , taking each reading for and twice. The readings were:
: values for were ; values for were
values for were ; values for were .
(d) Describe four sources of uncertainty or limitations of the procedure for this experiment.
A student releases a toy car to roll down a ramp, as shown.
The student measures the distance from the middle of the car as it is released to the bottom of the ramp and the distance travelled along the straight section before the car stops. He also measures the time taken to travel the distance . He then repeats the experiment using a different value of .
The student obtained readings with and , taking each reading for and twice. The readings were:
: values for were ; values for were
values for were ; values for were .
(e) Describe four improvements that could be made to this experiment. You may suggest the use of other apparatus or different procedures.
This apparatus shows a resistor in some water.
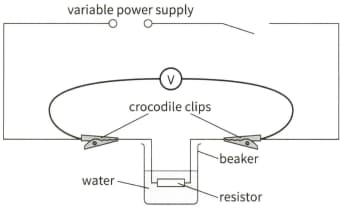
A student measures the rise in temperature of the water in using two different values of voltage.
The student wrote:
'When the voltage was set at , the rise in temperature of the water in was . The voltmeter reading decreased by about during the experiment, and so the final voltmeter reading was . 'The reading fluctuated from time to time by about . The smallest scale division on the thermometer was , but I could read it to . I did not have time to repeat the reading.
'When the voltage was set at , the rise in temperature in was and the voltage was almost the same at the end, but fluctuated by about ''
(a) Estimate the percentage uncertainty in the measurement of the first voltage.


