
A variable that measures the effect of a manipulated variable, is known as:
Important Questions on Graphical Representation of Data
The pie-chart represented below shows the spending by a family on various items during the year . Study the pie-chart carefully and answer the following question:

If the total amount spent during the year was , then the amount (in rupees) spent on food was
The pie-chart represented below shows the spending by a family on various items during the year . Study the pie-chart carefully and answer the following question:

According to the pie-chart, the maximum amount was spent on which item?
The pie-chart represented below shows the spending by a family on various items during the year . Study the pie-chart carefully and answer the following question:

If the total amount spent during the year was then how much money (in rupees) was spent on clothing and housing together?
The pie-chart represented below shows the spending by a family on various items during the year . Study the pie-chart carefully and answer the following question:

The ratio of the total amount of money spent on housing to the total amount of money spent on education was
The pie-chart represented below shows the spending by a family on various items during the year . Study the pie-chart carefully and answer the following question:
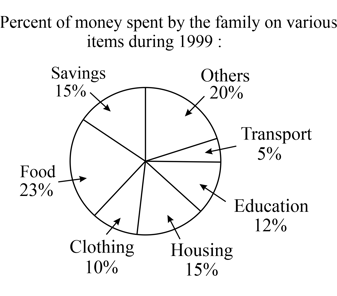
If the total expenditure of the family for the year was , then the savings (in rupees) of the family was
The population of a city is plotted as a function of time (years) in graphic form below:
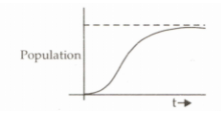
Which of the following inference can be drawn from the above plot?
The natural numbers from to are entered sequentially in columns, with the first rows as shown. The number occurs in column and row . The value of is:
| Column | Column | Column | Column | Column | Column | Column | |
| Row | |||||||
| Row | |||||||
| Row | |||||||


