
Air Quality Index abbreviated as AQI, is an index showing the quality of air at different locations. The AQI, at a particular time of the day in different Indian cities, are given below. The lower the AQI, the lesser the pollution.
City
AQI
New Delhi
Bangalore

Mumbai
Chennai
Hyderabad
Illustrate the data using the bar graph. Which city is the most polluted?
Important Questions on Data Handling
Shown below is the number of students studying at different sections of grade of a particular school.
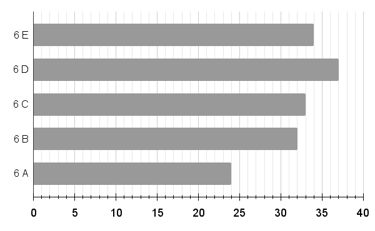
What is the difference between the number of students of the highest and the lowest populated sections?
The graph below shows the number of vehicles passed through a junction in half an hour.
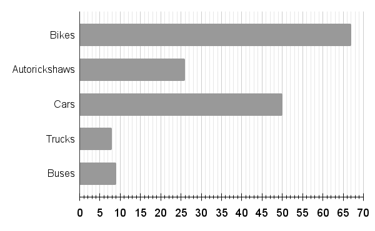
What fraction of the vehicles were trucks?
The pictograph below shows the number of students present in the class on two days of the week. The number represented by each symbol is also given.
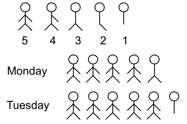
How many more students were present on Tuesday than Monday?
The children of a nursery are represented by the pictograph below. The number of children in LKG is .
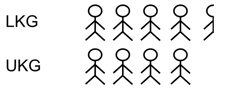
How many students are in UKG?
The bar graph below shows the number of different fruits stocked by a fruit vendor. The fruit of the highest quantity has a weight of .
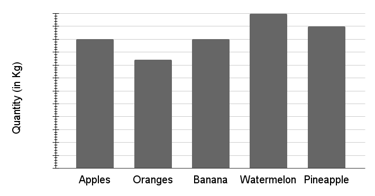
What is the weight of the fruit of the lowest quantity?
The graph below shows the weight distribution of cadets in an NCC camp. The cadets whose weight is below and above must undergo rigorous physical training and diet plan.
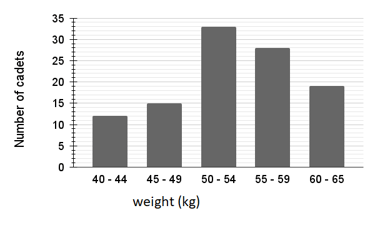
How many cadets must attend the physical training?
The table below is the information taken from the data register of visitors to a museum on different days of a particular week.
| Monday | Tuesday | Wednesday | Thursday | Friday | Saturday | |
| Males | ||||||
| Females | ||||||
| Children |
How many more children visited the museum on Saturday than Friday?


