
Ajeeta starts off from home at with her father on a scooter that goes at a uniform speed of . Her father drops her at her school after half an hour. She stays in the school till and takes an autorickshaw to return home. The autorickshaw has a uniform speed of . Draw the line graph for the given situation and also determine the distance of Ajeets's school from her home.
Important Questions on Line Graphs and Linear Graphs
The following table shows the percentage of students who dropped out of school after completing high school
| Year | |||||||
| Percentage of students who dropped out of school |
Study the above table carefully and draw a line graph to depict it.
The following chart gives the growth in height in terms of percentage of full height of boys and girls with their respective ages.
Study the table and draw the line graph of the data given below.
| Age (in Year) |
|||||||||||
| Boys | |||||||||||
| Girls |
Now, use the graph to answer the following question:
In which year both boys and the girls achieve their maximum height?
The following chart gives the growth in height in terms of percentage of full height of boys and girls with their respective ages.
Study the table and draw the line graph of the data given below.
| Age (in Year) |
|||||||||||
| Boys | |||||||||||
| Girls |
Now, use the graph to answer the following question:
Who grows faster at puberty ( years to years of age)
A car is travelling from city to city , which are apart. The line graph given below describes the distances of the car from the city at different times.
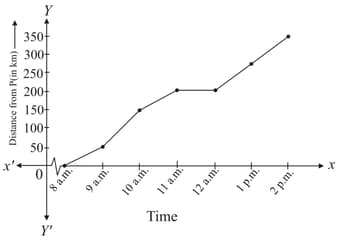
Study the above graph and answer the questions given below:
What information is given on the two axes?
A car is travelling from city to city , which are apart. The line graph given below describes the distances of the car from the city at different times.

Study the above graph and answer the questions given below:
From where and when did the car begin its journey?
A car is travelling from city to city , which are apart. The line graph given below describes the distances of the car from the city at different times.

Study the above graph and answer the questions given below:
How far did the car go in the first hour?
A car is travelling from city to city , which are apart. The line graph given below describes the distances of the car from the city at different times.

Study the above graph and answer the questions given below:
How far did the car go during the hour.
A car is travelling from city to city , which are apart. The line graph given below describes the distances of the car from the city at different times.
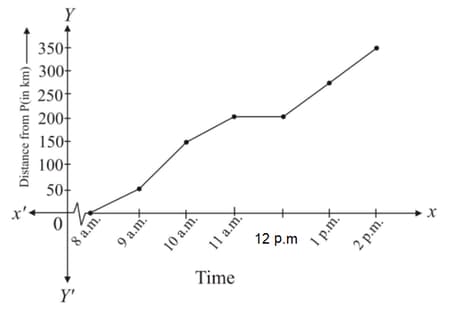
Study the above graph and answer the questions given below:
Was the speed same during first three hours? How do you know it?


