
Amit sowed a few seeds of in the ground. The height of the plant grew to 1.4 cm in the first four days. After that, it started growing faster.
Amit measured the height of the plant after every four days and put a dot on the chart. For example, if you look at the dot marked on the fourth day, you can see on the left side scale that it is 1.4 cm high.
Now look at the height of each dot in cm and check from the table if he has marked the dots correctly.
Day
Length of the plant (in )
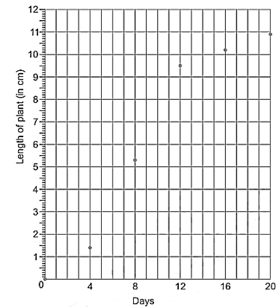
Find out from the growth chart
What could be the length of this plant on the day? Guess.
Length of the plant (in )
Important Questions on Smart Charts
Yamini did a project ‘Animals and Birds’. She asked each child of her class about one favourite pet animal.
She used tally marks to record each answer. For example if someone said ‘cat’ she put one line  in front of ‘cats’. When someone said ‘cat’ again, she added a line. So
  means two cats and
  means cats. In all children said ‘cat’ was their favourite animal. Help Yamini complete the table.
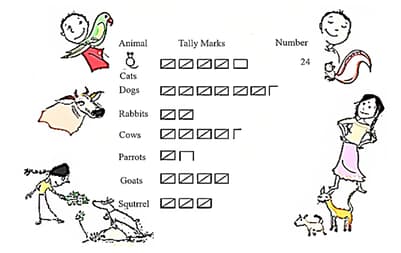
Look at the tally marks and write the number for each animal in the table. How many children did Yamini talk to?
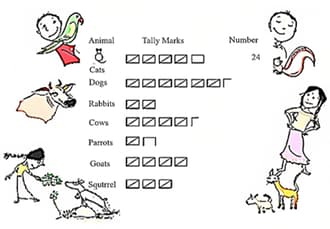
Yamini did a project 'Animals and Birds'. She asked each child of her class about one favourite pet animal.
She used tally marks to record each answer. For example if someone said 'cat' she put one line $l$ in front of 'cats'. When someone said 'cat' again, she added a line. So  means two cats and
  means cats. In all children said 'cat' was their favourite animal. Help Yamini complete the table.
Which is the most favourite pet animal in this table?
Sumita stood on the road for half an hour and counted the number of vehicles passing by. She made a tally mark for each vehicle. This helped her in counting quickly the total number of vehicles in each group. Write the number of each vehicle in the table.
Note:


Sumita stood on the road for half an hour and counted the number of vehicles passing by. She made a tally mark for each vehicle. This helped her in counting quickly the total number of vehicles in each group. How many vehicles in all did Sumita see on the road in half an hour?
Note:

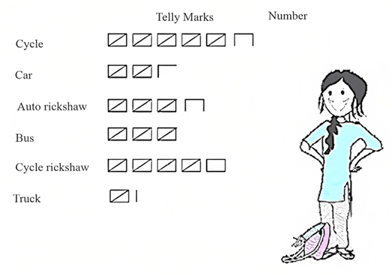
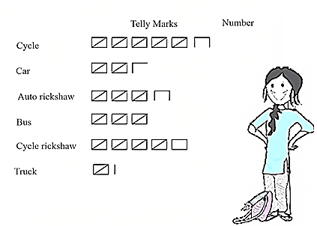
Sumita stood on the road for half an hour and counted the number of vehicles passing by. She made a tally mark for each vehicle. This helped her in counting quickly the total number of vehicles in each group.
| Tally marks | |
| Cycle |  |
| Car |  |
| Auto rickshaw |  |
| Bus |  |
| Cycle rickshaw |  |
| Truck |  |
State True or False: Auto rickshaws are thrice the number of trucks.
Sumita stood on the road for half an hour and counted the number of vehicles passing by. She made a tally mark for each vehicle. This helped her in counting quickly the total number of vehicles in each group.
Note:

Make tally marks for more buses, and more trucks.
In the EVS period, the teacher asked children whether they help their parents at home. There were different answers. Children named the work in which they help their parents the most. The teacher collected their answers and made a table.
| Help most in house work | Number of children |
|---|---|
| Going to the market | |
| Washing utensils | |
| Washing clothes | |
| Making, serving food | |
| Cleaning the house | |
|
Total children who said they help their parents |
In the EVS period, the teacher asked children whether they help their parents at home. There were different answers. Children named the work in which they help their parents the most. The teacher collected their answers and made a table.
Now you can fill the chapati chart to show the numbers given in the table.
| Help most in house work | Number of children |
| Going to the market | |
| Washing utensils | |
| Washing clothes | |
| Making, serving food | |
| Cleaning the house | |
|
Total children who said they help their parents |


