
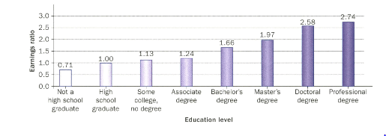
An earning ratio shows how much someone earns in comparison to a standard . The standard is usually represented by , so an earning ratio above means earning more than the standard. An earning ratio leas than means earning less than the standard . The earnings ratios for a range of education levels are represented in this bar chart.
Which education level is the standard against which others are compared?
Important Questions on Data Management Trends in Communities
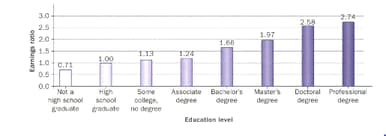
An earning ratio shows how much someone earns in comparison to a standard . The standard is usually represented by , so an earning ratio above means earning more than the standard. An earning ratio leas than means earning less than the standard . The earnings ratios for a range of education levels are represented in this bar chart.

What information does the graph convey? Explain your reasoning.
An earning ratio shows how much someone earns in comparison to a standard . The standard is usually represented by , so an earning ratio above means earning more than the standard. An earning ratio leas than means earning less than the standard . The earnings ratios for a range of education levels are represented in this bar chart.
How much education would you need in order to earn at least twice as much as a high school graduate?
An earning ratio shows how much someone earns in comparison to a standard . The standard is usually represented by , so an earning ratio above means earning more than the standard. An earning ratio leas than means earning less than the standard . The earnings ratios for a range of education levels are represented in this bar chart.

Is this the most effective way to represent this data? Explain
| Number of texts sent per day | Percentage of teen responses | Percentage of adult responses |
| or more |
Use technology to represent each column of responses with a circle graph.
| Number of texts sent per day | Percentage of teen responses | Percentage of adult responses |
| or more |
Use technology to represent this data using multiple bar graphs
| Number of texts sent per day | Percentage of teen responses | Percentage of adult responses |
| or more |
Which representation is more effective ? Explain your answer.
| Number of texts sent per day | Percentage of teen responses | Percentage of adult responses |
| or more |
What characteristics about each group does this reveal regarding texting ? Explain
| Number of texts sent per day | Percentage of teen responses | Percentage of adult responses |
| or more |
Draw a graph for how you think the same age groups would have responded ten years ago. Explain your graph.


