
An open-end class is a class that lacks either a lower limit or a higher limit.
Important Questions on Organisation of Data
Use the data given in the table that relate to monthly household expenditure (in Rs) on the food of households.
Monthly Household Expenditure (in Rupees) on Food of 50 Households
Find the number of households whose monthly expenditure on food is more than .
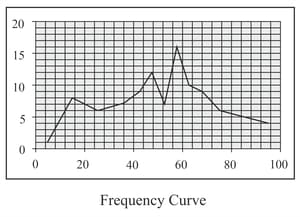
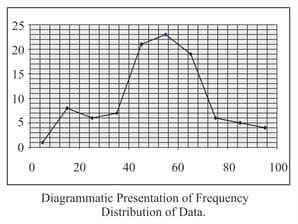
If you compare the figure with the figure . What do you observe? Do you find any difference between them? Can you explain the difference?
Use the data given in the table that relate to monthly household expenditure (in Rs) on the food of households.
Monthly Household Expenditure (in Rupees) on Food of 50 Households
Find the number of households whose monthly expenditure on food is less than
Use the data given in table that relate to monthly household expenditure (in Rs) on food of households.
Monthly Household Expenditure (in Rupees) on Food of 50 Households
Obtain the range of monthly household expenditure on food.
Use the data given in the table that relate to monthly household expenditure (in Rs) on food of households.
Find the number of households whose monthly expenditure on food in between and .
Find the range of yield of wheat in table below.
The yield of wheat for different countries
| Country | Yield of wheat(kg/hectare) |
| Canada | |
| China | |
| France | |
| Germany | |
| India | |
| Pakistan |
The quick brown fox jumps over the lazy dog.
Read the above sentence carefully and note the numbers of letters in each word. Treating the number of letters as a variable, prepare a frequency array for this data.
Find the range of the population of India from the table below:
Population of India (in crores)
| Year | Population(in crores) |
Use the data given in the table that relate to monthly household expenditure (in Rs) on the food of households.
Monthly Household Expenditure (in Rupees) on Food of 50 Households
Divide the range into appropriate number of class intervals and obtain the frequency distribution of expenditure.


