
Anita made some musical instruments using pipes of different lengths. The mathematical relation between the length of pipe (in ) and the pitch (cycles per second) of music is shown in the table below:
Pitch (cycles per second)
Length of pipe (in )

Look at the graph and answer the following question:
What should be the length of pipe to obtain a pitch of cycles per second?
What should be the length of pipe to obtain a pitch of cycles per second?
Important Questions on Graphs
Anita made some musical instruments using pipes of different lengths. The mathematical relation between the length of pipe (in ) and the pitch (cycles per second) of music is shown in the table below:
| Pitch (cycles per second) | ||||||||
| Length of pipe (in ) |
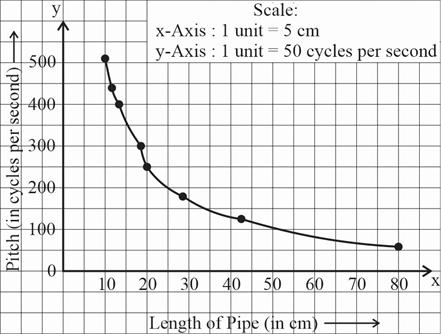
Look at the graph and answer the following questions:
What will be the pitch when the length of pipe is
Two tables, and are given below. Draw graphs for quantities shown in the tables and find out whether is constant?
| Table | |||||
| Radius of a circle, in | |||||
| Perimeter of a circle, in | |||||
| Table | |||||
| Radius of a circle, in | |||||
| Area of a circle, in | |||||
The temperature data for a particular day in a city are shown in the graph. Answer the following questions based on the graph:

What was the city temperature at
The temperature data for a particular day in a city are shown in the graph. Answer the following question based on the graph:

What was the city temperature at in the afternoon?
The temperature data for a particular day in a city are shown in the graph. Answer the following questions based on the graph:
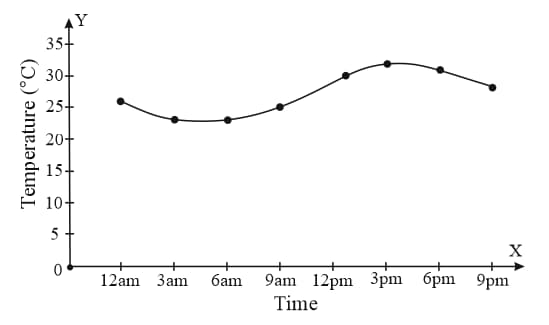
At what time was the temperature
The temperature data for a particular day in a city are shown in the graph. Answer the following questions based on the graph:

What would have been the temperature at midnight?
The temperature data for a particular day in a city are shown in the graph. Answer the following questions based on the graph:

What was the temperature at pm in the night?
The pollutions levels of a city were monitored throughout a day. The pollution levels are shown in a graph; answer the question based on the graph:-
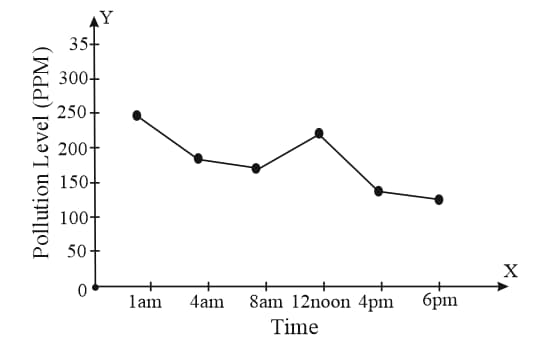
What was the pollution level at in the morning?


