
Answer the question based on the line-graph given below.
Ratio of Exports to Imports (in terms of money in Rs.crores) to Two Companies Over the Years.
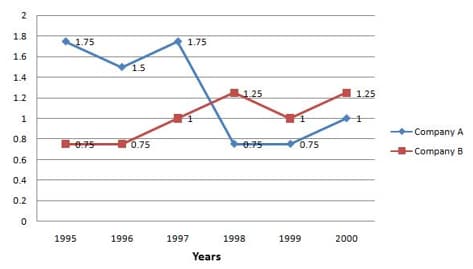
In which year(s) was the difference between imports and exports of Company B the maximum?
Important Questions on Data Interpretation
Study the following graph and answer the question based on it.
Exports from Three Companies Over the Years (in Crores Rs.)
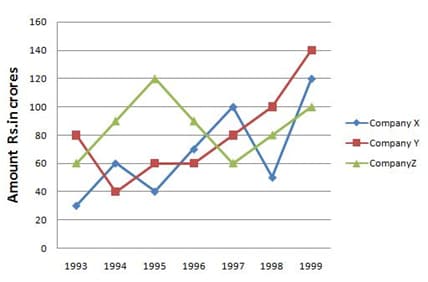
Average annual exports during the given period for Company Y is approximately what percent of the average annual exports for company Z?
Percentage Profit Earned by Two Companies X and Y over the Given Years
% Profit/Loss Income Expenditure/Expenditure
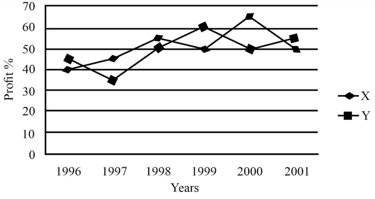
If the expenditures of Companies X and Y in 1996 were equal and the total income of the two companies in 1996 was what was the total profit of the two companies together in 1996? (Profit Income Expenditure)
In a school, the periodical examinations are held every second month. In a session during Apr. -Mar. . A student of Class appeared for each of the periodical exams. The aggregate marks obtained by him in each periodical exam are represented in the line-graph given below. Study the graph and answer the question based on it.
Marks obtained by a student in six periodical exams held in every two months during the year in the session
Maximum Total Marks in each Periodical Exam
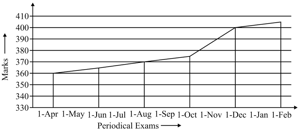
What are the average marks obtained by the student in all the periodical exams during the session?
The given graph represents Percent Profit Earned by two Companies A and B over particular years.
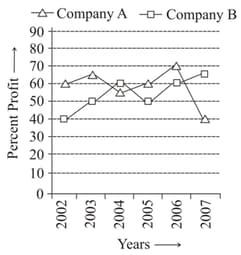
Expenditures of Company B in 2003 and 2004 are lakh and lakh, respectively. What was the total income of Company B in 2003 and 2004 together?
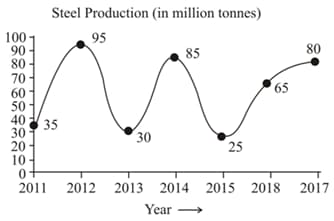
The line graph shows the production of steel of a certain country. Study the diagram and answer the following question –
The steel production in were greater than that of by
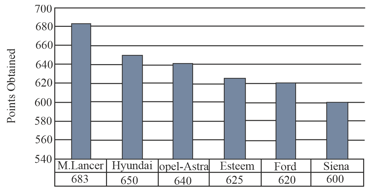
Study the given graph and answer the following questions.
An International agency surveyed the performance of cars.
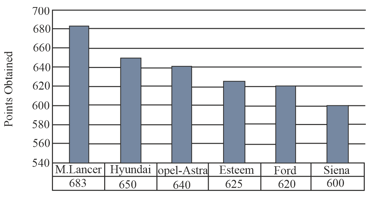
The Points are given on the basis of the following features
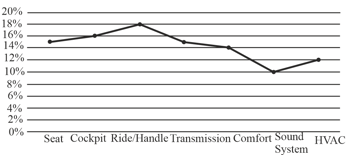
Points obtained by the sound system of Opel-Astra is approximately what percent of points obtained by the sound system of M. Lancer?
Study the given graph and answer the following questions.
An International agency surveyed the performance of cars.
The Points are given on the basis of the following features
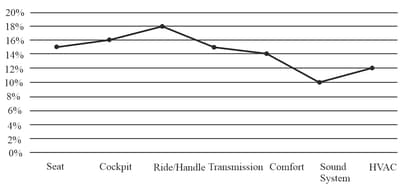
The points obtained by the transmission of Esteem are equal to points obtained by?
Study the given graph and answer the following questions.
An International agency surveyed the performance of cars.

The Points are given on the basis of the following features
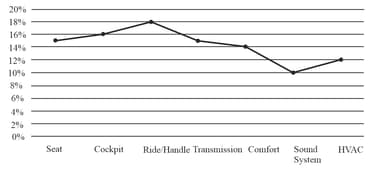
The points earned by Hyundai on the basis of comfort are what percent more/less than the points earned by Siena on the basis of ride/handle?


