Arable land is land that is used for growing crops. The amount of arable land can indicate how able a country is to produce food to support its citizens countries with the highest percentage of arable land (as a percentage of total land area) are listed in the table below.
Higher-income countries
Lower-income countries
Denmark
58%
Bangladesh
59%
Hungary
49%
Ukraine
56%
Czech Republic
41%
Moldova
55%
Isle of Man
39%
India
53%
Lithuania
38%
Togo
49%
Poland
36%
Burundi
47%
Germany
34%
Rwanda
47%
France
34%
The Gambia
44%
Is knowing the percentage of land that is arable sufficient information to determine a country's ability to grow its own crops? Explain.If not, what other factors would be important to research?
Important Questions on Univariate Data Accessing Equal Opportunities
The number of people per public wi-fi hotspot, in those countries where hotspots are available, is summarised below.These represent the highest values among high-income countries.
| Country | Number of people per public wi-fi hotspot |
| Canada | 14 |
| Singapore | 320 |
| Italy | 979 |
| Spain | 13 |
| Norway | 12 |
| Germany | 10 |
| Australia | 11 |
| United Arab Emirates | 40 |
| Poland | 11 |
| Japan | 10 |
| United Kingdom | 6 |
| Sweden | 9 |
Find the range, quartiles and interquartile range of this data set. Round to the nearest tenth where necessary.
The number of people per public wi-fi hotspot, in those countries where hotspots are available, is summarised below.These represent the highest values among high-income countries.
| Country | Number of people per public wi-fi hotspot |
| Canada | 14 |
| Singapore | 320 |
| Italy | 979 |
| Spain | 13 |
| Norway | 12 |
| Germany | 10 |
| Australia | 11 |
| United Arab Emirates | 40 |
| Poland | 11 |
| Japan | 10 |
| United Kingdom | 6 |
| Sweden | 9 |
Are there any outliers in this data set? Explain.
The number of people per public wi-fi hotspot, in those countries where hotspots are available, is summarised below.These represent the highest values among high-income countries.
| Country | Number of people per public wi-fi hotspot |
| Canada | 14 |
| Singapore | 320 |
| Italy | 979 |
| Spain | 13 |
| Norway | 12 |
| Germany | 10 |
| Australia | 11 |
| United Arab Emirates | 40 |
| Poland | 11 |
| Japan | 10 |
| United Kingdom | 6 |
| Sweden | 9 |
Find the range, quartiles and interquartile range of the data set with any outliers removed.
The number of people per public wi-fi hotspot, in those countries where hotspots are available, is summarised below.These represent the highest values among high-income countries.
| Country | Number of people per public wi-fi hotspot |
| Canada | 14 |
| Singapore | 320 |
| Italy | 979 |
| Spain | 13 |
| Norway | 12 |
| Germany | 10 |
| Australia | 11 |
| United Arab Emirates | 40 |
| Poland | 11 |
| Japan | 10 |
| United Kingdom | 6 |
| Sweden | 9 |
Which is most affected by the presence of outliers, the range or the interquartile range?Explain.
Create a set of data with an odd number of values(at least seven) where the three quartiles are all whole numbers.
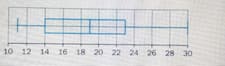
Find the range, the three quartiles and the interquartile range for data represented by the following box-and-whisker plots.