
Choose the correct statement regarding histograms and bar graphs.
Bar graphs and Histograms are represented using bars which represent the data.
In bar graph data is represented in only vertical bars.
In bar graph there is no difference between two bars while histogram has.
Important Questions on Graphical Representation of Data
Choose the correct statement which best describes the difference between bar graph and histogram.
Bar graph represents the data in range.
Histogram represents the categorical data.
Fill up the blank:
For a histogram, _____ is a zig-zag line that is used when the scale on the x-axis doesn't start from .
In an examination, of candidates got second class. When the data are represented by a pie chart, what is the angle corresponding to second class?
Coronavirus disease (COVID) is an infectious disease caused by the SARS-CoV virus.
Most of the people who got infected with this virus have experienced mild to moderate respiratory illness and recovered soon. But, some people have become seriously ill and required medical attention. Older people who have other medical conditions like diabetes, chronic respiratory disease, or cardiovascular disease etc. will be infected easily and develop serious illness. Anyone, at any age, can get sick with Coronavirus and become seriously ill or die.

During a survey, the ages of patients who are infected and admitted in a city hospital are recorded. The data is represented using the histogram as show below:

The age group of the lowest number of patients infected by Covid is
Coronavirus disease (COVID) is an infectious disease caused by the SARS-CoV virus.
Most of the people who got infected with this virus have experienced mild to moderate respiratory illness and recovered soon. But, some people have become seriously ill and required medical attention. Older people who have other medical conditions like diabetes, chronic respiratory disease, or cardiovascular disease etc. will be infected easily and develop serious illness. Anyone, at any age, can get sick with Coronavirus and become seriously ill or die.

During a survey, the ages of patients who are infected and admitted in a city hospital are recorded. The data is represented using the histogram as show below:
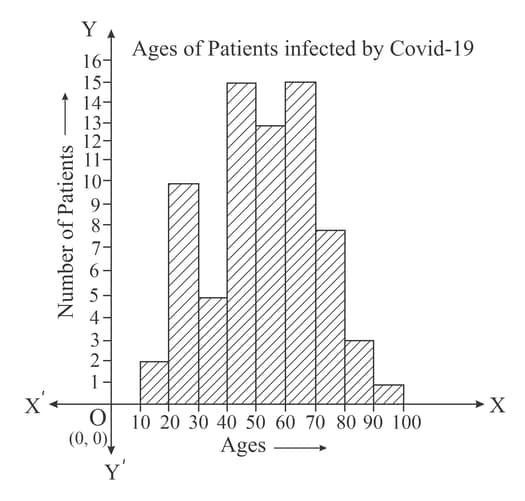
The average of the number of patients in each group is
For drawing a frequency polygon of a continuous frequency distribution, we plot the points whose ordinates are the frequencies of the respective classes and abscissa are respectively:


