
Construct a combined histogram and frequency polygon for the following data:-
Weekly earnings
(in rupees)
No. of workers
Weekly earnings
(in rupees)
Important Questions on Statistics
In a study of diabetic patients, the following data was obtained:-
|
Age (in years) |
|||||||
|
No. of patients |
Represent the above data by a histogram and a frequency polygon.
The water bills of houses in a locality are given below:
Taking class interval . from frequency distribution table, construct a combined histogram and frequency polygon.
The number of matchsticks in boxes on counting was found as given below:
Taking classes construct the frequency distribution table for the above data. Also draw a combined histogram and frequency polygon to represent the distribution.
The histogram showing the weekly wages (in ) of workers in a factory is given alongside.
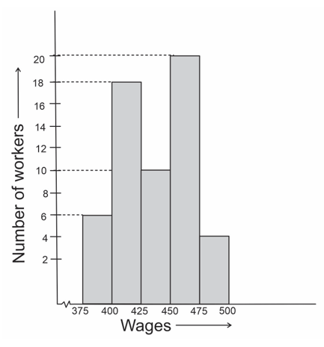
What is the frequency of class ?
The histogram showing the weekly wages (in ) of workers in a factory is given alongside.
What is the class having a minimum frequency?
The histogram showing the weekly wages of workers in a factory is given alongside.
What is the cumulative frequency of the class ?
The histogram showing the weekly wages of workers in a factory is given alongside.
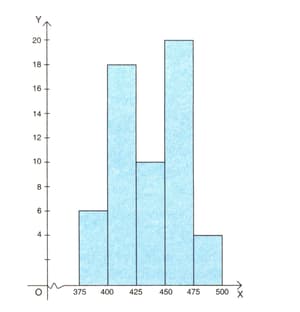
Construct a frequency and cumulative frequency table for the given distribution.
the runs scored by two team A and B on the first in a circket match are given below:
| no. of balls | 1-6 | 7-12 | 13-18 | 19-24 | 25-30 | 31-36 | 37-42 |
| Runs scored by team A | 2 | 1 | 8 | 9 | 4 | 5 | 6 |
| Runs scored by team B | 5 | 6 | 2 | 10 | 5 | 6 | 3 |


