
Construct a double bar graph, using the table given below:
Suppose population of India and China are
Important Questions on Introduction to Graphs
The given pie chart shows information about Non–Peforming Assets (NPA) Processed by the various banks of India till December 2017.
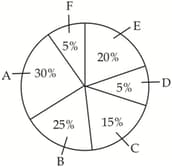
If the total NPAs under all the banks are worth Rs. lakh crores, then NPAs worth how much (in Rs. lakh crores) does Bank ‘D’ contain till December 2017?
The given bar graph shows the number of students of two schools over a period of six years.
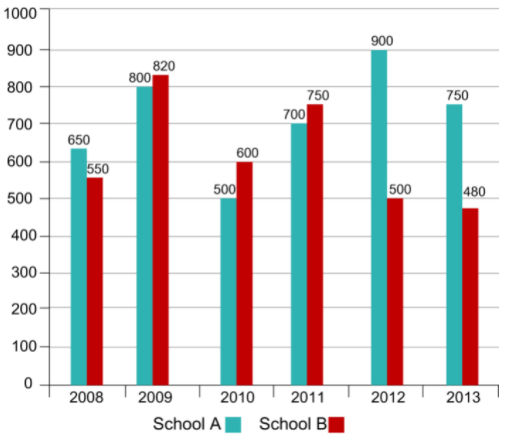
In the bar graph, what is the ratio of students taken for the years together from school A to the students taken for the years together from school B?
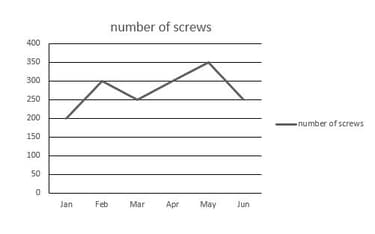
According to the chart below, in which month less than screws were manufactured?
The monthly fees for facilities provided by a sports complex house is as follows:
For Gym, for Swimming Pool , for Tennis court . The list of members using these facilities is as below. How much do they earn from members using the gym each month?
| Facilities | Number of Members |
| Gym | |
| Swimming Pool | |
| Tennis Court |
The given bar graph shows the number of students of two schools over a period of six years.
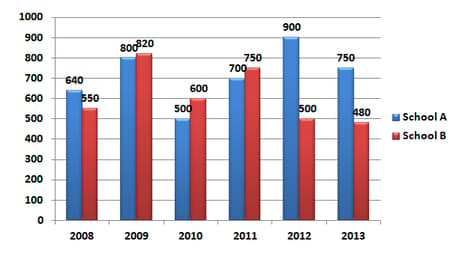
In the bar graph, what is the ratio of the average of the total students from school A to the average of the total students from school B?
The given pie chart below informs us about non performing assets (NPA) of different banks till Dec. 2017.
If the total NPA of all the banks is Rs 300 lakh crore, then what will be the total NPA (in lakh crore) of bank ‘A’ till December 2017?
The expenditure of a municipal corporation of a city in different sectors is given below:
| Sector | Expenditure (in Lakh) |
| Education | |
| Health services | |
| Beautification | |
| Surface transport | |
| Others |
Draw a pie-chart to represent the above data.
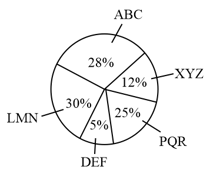
Study the following pie chart carefully and answer the question given below.
The pie chart shows information about $5$ mobile phone manufacturing companies in India. The total units of mobile phones manufactured by these companies together is $12,40,000$.
How many units of mobile phones are manufactured by company ‘DEF’?
The given bar graph represents the number of boys and girls in five different schools. Study the graph and answer the question that follows.
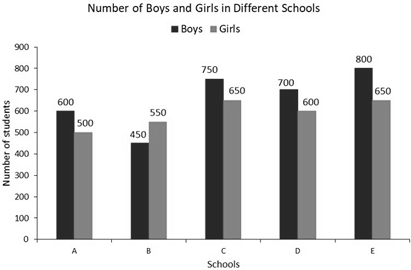
What is the ratio of girls and boys from all the schools taken together?
The given bar graph represents the number of boys and girls in five different schools. Study the graph and answer the question that follows.

What is the average number of boys in schools A, B, C, D and E?
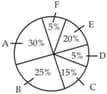
Using the pie-chart answer the following:
If the annual income of the family is , the savings is:
The given graph shows the number of students of two schools over a period of six years.
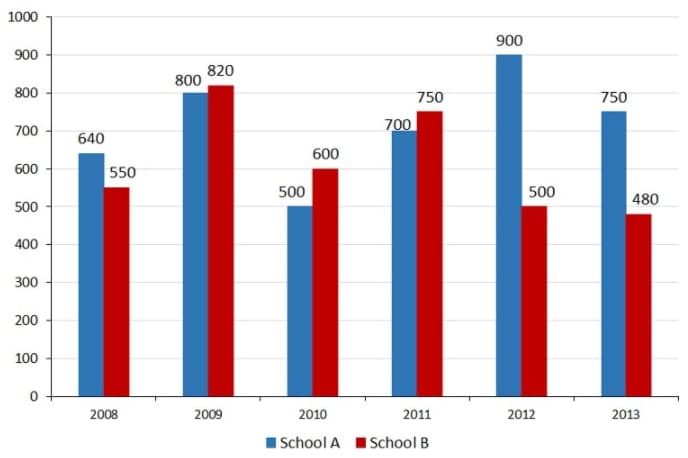
In the bar graph, in which year is the sum of the students from schools A and B taken together, the minimum?
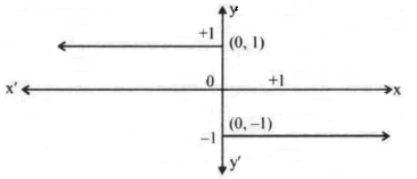
The equation of the graph shown here is:
The HR department of a company prepared a report. The pie chart from this report shows number of employees in all the departments that the company has. Study the diagram and answer the following questions.
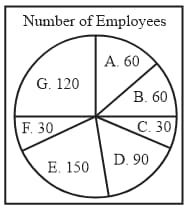
If the average monthly salary of the employees of this company is then, what is the total of the salaries (in lacs) paid to all the employees of this company?
Using the pie-chart answer the following:
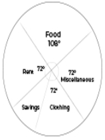
If the annual income of the family is , then the savings are:
As per data shown in the following table,what is the percentage of students who got less than marks?
|
Marks obtained |
|||||||
|
Number of students |
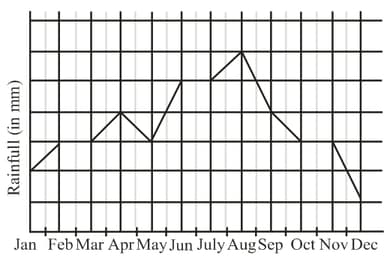
The above graph depicts the average monthly rainfall for a particular year in the country . Select the incorrect option :
The given bar graph represents the number of boys and girls in five different schools. Study the graph and answer the question that follows.
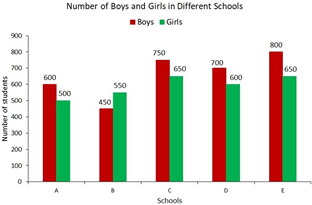
In which school is the percentage of girls the lowest?
The given bar graph shows the number of students of two schools over a period of six years.
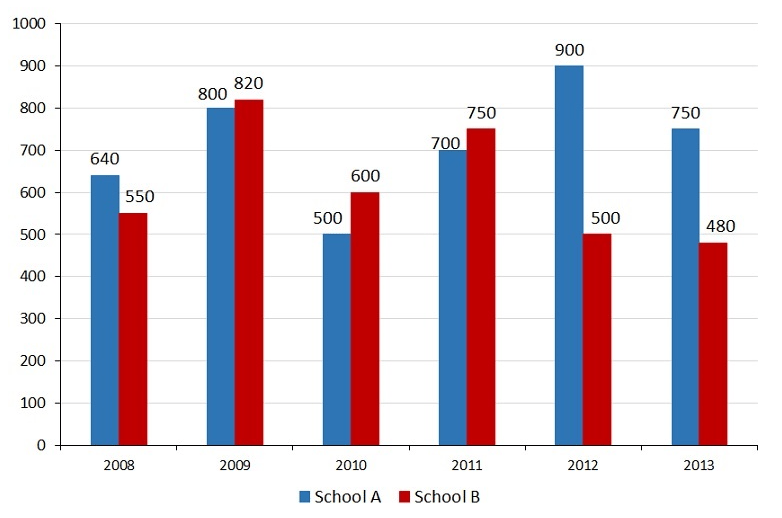
In the bar graph, what is the ratio of students taken for the years together from school A to the students taken for the years together from school B?
Study the graph and answer the question.
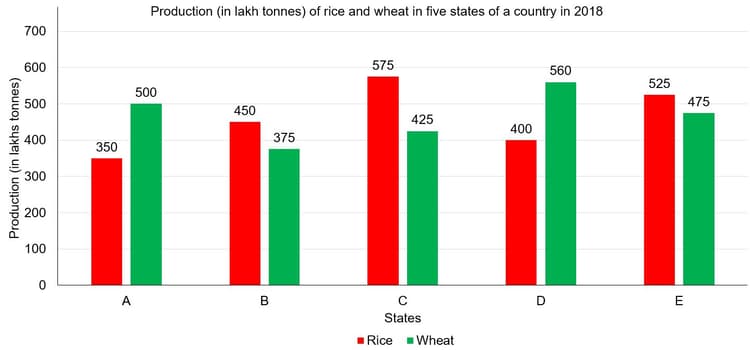
Total production of wheat in states , and is what percentage less than the total production of the rice in states , and ?


