
Construct a frequency distribution table for the numbers given below, using the class intervals etc.
and .
Use the table obtained to draw an ogive.
Important Questions on Graphical Representation (Histograms and Ogives)
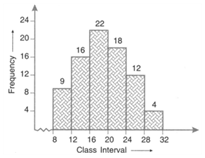
Use the information given in the adjoining histogram to construct a frequency table.

Use this table to construct an ogive.
| Class mark | |||||||
| Frequency |
From the distribution, given above, construct a frequency table.
| Class mark | |||||||
| Frequency |
Use the table obtained in part (a) to draw :
(i) a histogram,
(ii) an ogive.
Use graph paper for this question.
The table given below shows the monthly wages of some factory workers.
Using the table, calculate the cumulative frequencies of workers.
| Wages | |||||||
| No. of workers |
Use graph paper for this question.
The table given below shows the monthly wages of some factory workers.
Draw a cumulative frequency curve.
Use , starting the origin at on -axis, and workers on the -axis.
| Wages | |||||||
| No. of workers |
The following table shows the distribution of the heights of a group of factory workers:
| Ht.(cm): | |||||||
| No. of workers : |
Determine the cumulative frequencies.
The following table shows the distribution of the heights of a group of factory workers:
| Ht.(cm): | |||||||
| No. of workers : |
Draw the 'less than' cumulative frequency curve on graph paper. Use height on one axis and workers on the other.


