Construct class intervals and frequencies for the following distribution table. Also draw the ogive curves for the same.
Marks obtained
Less than
Less than
Less than
Less than
Less than
Number of students
Important Questions on Frequency Distribution Tables and Graphs
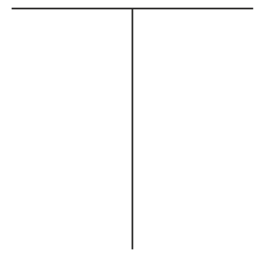
The ability of some graphs and charts to distort data depends on perception of individuals to figures. Consider the diagram and answer the following question both before and after checking.
Which is longer, the vertical or horizontal line?
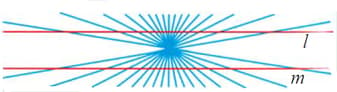
The ability of some graphs and charts to distort data depends on perception of individuals to figures. Consider the diagram and answer the following question both before and after checking.
Are lines l and m are straight and parallel?
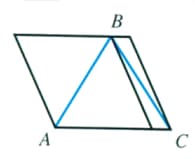
The ability of some graphs and charts to distort data depends on perception of individuals to figures. Consider the diagram and answer the following question both before and after checking.
Which line segment is longer: or .
The ability of some graphs and charts to distort data depends on perception of individuals to figures. Consider the diagram and answer the following question both before and after checking.
How many sides does the polygon have? Is the shape of the poygon is a square shape?
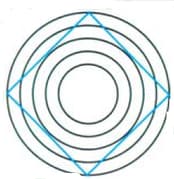
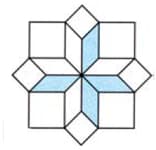
The ability of some graphs and charts to distort data depends on perception of individuals to figures. Consider the diagram and answer the following question both before and after checking.
Stare at the diagram below. Can you see four large posts rising up out of paper? State some and see four small posts.